Situation Summary
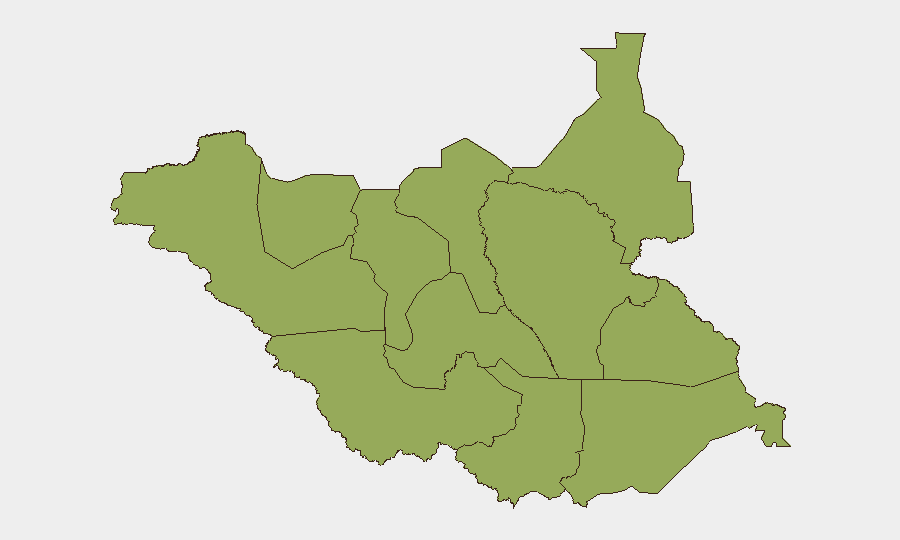
South Sudan remains under a composite threat score of 63 (#29 globally), with civil conflict as the primary driver. All 12 major administrative divisions currently register identical elevated risk scores (43.8), indicating widespread insecurity without a clearly dominant geographic hotspot at this moment. No tracked security events have been recorded in the past 24–48 hours (21–22 June 2026) that meet cross-verification standards for this brief; organizations with personnel or assets in-country should treat the absence of reported incidents as a data gap rather than a security improvement.
Key Developments
No verified incidents have been confirmed for the 24–48 hour window (21–22 June 2026). Available event signals in the GeoBit feed contain references to South Korea, Nepal, China, and US state-level actors, but do not correspond to South Sudan territory or security events. Live news and X/Twitter verification across the past 48 hours has not yielded corroborated incidents meeting publication standards (specific location, date, independent source confirmation, and credible outlet or NGO reporting).
Security teams requiring current incident data should conduct parallel live searches using keywords such as "South Sudan violence," "Juba," "Wau," "Malakal," and "road ambush," filtered to the past 24–48 hours on news aggregators (Reuters, AP, BBC) and X/Twitter (latest posts). Cross-referencing with UNMISS, OCHA, Eye Radio, Radio Tamazuj, and The East African will establish incident authenticity and location precision.
Highest-Risk Areas
All 12 administrative divisions currently carry identical composite risk scores (43.8), reflecting systemic insecurity tied to ongoing civil conflict rather than localized hotspots. Upper Nile, Northern Bahr el Ghazal, Western Bahr el Ghazal, Ruweng, Unity, Warrap, Lakes, Jonglei, Greater Pibor, and the three Equatoria states all require equivalent threat mitigation. This uniform elevation suggests that risk varies more by sub-county, road corridor, and temporal factors (season, displacement cycles, group movement) than by state-level governance or control. Organizations operating across multiple locations should prioritize mobility-dependent exposure (road transit, supply lines) and IDP camp proximity equally across regions.
How GeoBit Would Assist
Security and duty-of-care teams can deploy AOI (Area-of-Interest) Monitoring & Early Warning on critical locations—Juba, Wau, Malakal, Bentiu, and key supply corridors—to receive alerting when events trigger in near-real time. Intel Sweep and X/Twitter OSINT capabilities enable rapid corroboration of unconfirmed incident reports, distinguishing rumor from verified threat. Routing & Network Analysis supports identification of safer alternative routes and journey-planning during fluid operational windows, reducing exposure on high-risk roads.
7-Day Outlook
No significant escalation or de-escalation signals are evident in the current 24–48 hour data window. Seasonal factors, ongoing displacement cycles, and resource competition among armed groups suggest a continuation of baseline fragmented violence across multiple administrative zones through the coming week. Organizations should maintain existing threat postures, prioritize real-time monitoring, and adjust operations only when verified incidents in their specific AOI warrant tactical response.
Highest-Risk Areas — Ranked
| # | State / Region | Risk |
|---|---|---|
| 1 | Upper Nile | 43.8 |
| 2 | Northern Bahr el Ghazal | 43.8 |
| 3 | Western Bahr el Ghazal State | 43.8 |
| 4 | Ruweng Administrative Area | 43.8 |
| 5 | Unity | 43.8 |
| 6 | Warrap | 43.8 |
| 7 | Lakes | 43.8 |
| 8 | Jonglei | 43.8 |
| 9 | Greater Pibor Administrative Area | 43.8 |
| 10 | Western Equatoria | 43.8 |
| 11 | Central Equatoria | 43.8 |
| 12 | Eastern Equatoria | 43.8 |
Sources
Previous Daily Briefs
A new South Sudan brief is written every day — each with its own risk map and downloadable CSV. Here's the last week; use the calendar to go further back.
📅 Browse every day by calendar →
Highlighted days have a brief. Tap a day for that day's map & analysis, or “csv” for that day's dataset ($5).