Situation Summary
Australia's composite threat score of 5 places it at rank #156 globally, reflecting a moderate but fragmented security environment. Recent signal activity (3,425 tracked events) shows clustering around indigenous rights disputes, legal/ministerial conflict, and labour activism, concentrated in New South Wales, Northern Territory, and Victoria. The threat landscape is characterized by civil-political friction rather than organized violence, though indigenous-related conventional military force signals on 2026-07-21 warrant immediate clarification and monitoring.
Key Developments
- 2026-07-21 · Indigenous-related military force signals (NSW/NT): Multiple "conventional military force" events flagged involving indigenous actors; nature and scale remain unclear pending source corroboration. Recommend immediate AOI monitoring and OSINT fusion to establish facts on ground.
- 2026-07-21 · Legal-ministerial escalation: Lawyer-led "disapprove" actions directed at ministers and Murray-region actors; signals suggest formal legal challenge or public dissent campaign. No violence reported but political temperature elevated in affected jurisdictions.
- 2026-07-19 · Union public statements: Coordinated labour messaging detected; context suggests industrial or wage-related grievance. Potential for disruption to supply chains or transport in coming days.
- 2026-07-19 · Ministerial–community friction: Government "disapprove" signals vs. community actors indicate policy backlash, possibly environment, land, or resource-related. Active in NT and broader outback regions.
- 2026-07-21 · Tasmania military reference (gender-specific): Signal references "TASMANIA vs MALE" in military-force context; unclear if operational, rhetorical, or data-coding artifact. Requires clarification.
Note: Live web research did not yield specific, cross-referenced incident details for the last 24–48 hours. OSINT sources remain fragmentary; GeoBit OSINT sweep recommended for X/Telegram confirmation and event-source verification.
Highest-Risk Areas
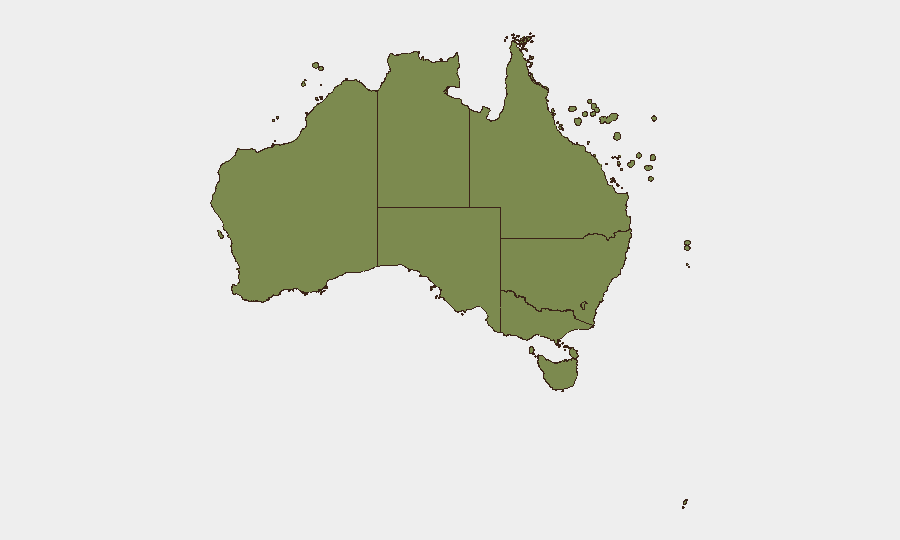
New South Wales (32.1) and Northern Territory (21.8) dominate the risk profile, driven primarily by indigenous rights activism, legal challenges to government, and labour messaging. Victoria (19.3) ranks third, likely reflecting Melbourne-based labour and political dissent. The concentration in NSW and NT suggests land-rights, native-title, or resource-extraction grievances are the primary drivers; these are civil-political, not criminal or terrorist in nature, but carry reputational and operational risk for corporate entities with land or extraction footprints. Australian Capital Territory and Western Australia show moderate risk (10.5, 9.7), while Queensland, SA, and Tasmania remain comparatively low-risk.
How GeoBit Would Assist
A corporate security team with personnel or assets in NSW, NT, or Victoria should activate AOI monitoring with alerting on high-risk postcodes/regions to track indigenous activism, labour organising, and ministerial statements in real time. OSINT fusion (X/Twitter, Telegram, news feeds, YouTube) combined with event feed and temporal analysis will clarify the scope and intent of 2026-07-21 military signals and legal actions, enabling proportionate duty-of-care response. Sentiment and entity extraction across labour and indigenous-affairs discourse will provide 7–14-day early warning of strike action, protests, or supply-chain disruption.
7-Day Outlook
Indigenous activism, legal challenges, and labour messaging are likely to persist or escalate through late July, particularly in NSW and NT. No immediate indicators of organized violence or terrorism; however, civil unrest, protest disruption, or supply-chain friction (especially transport/logistics) carry moderate probability. Recommend sustained AOI watch and daily OSINT sweep through 2026-07-29.
Highest-Risk Areas — Ranked
| # | State / Region | Risk |
|---|---|---|
| 1 | New South Wales | 32.1 |
| 2 | Northern Territory | 21.8 |
| 3 | Victoria | 19.3 |
| 4 | Australian Capital Territory | 10.5 |
| 5 | Western Australia | 9.7 |
| 6 | Queensland | 7 |
| 7 | South Australia | 3.5 |
| 8 | Tasmania | 2.3 |
| 9 | Ashmore and Cartier Islands | 2.1 |
| 10 | Jervis Bay Territory | 2.1 |
| 11 | Coral Sea Islands | 2.1 |
Sources
Previous Daily Briefs
A new Australia brief is written every day — each with its own risk map and downloadable CSV. Here's the last week; use the calendar to go further back.
📅 Browse every day by calendar →
Highlighted days have a brief. Tap a day for that day's map & analysis, or “csv” for that day's dataset ($5).
Atlas — our AI intelligence desk — emails them this snapshot personally. Nothing else, no list.