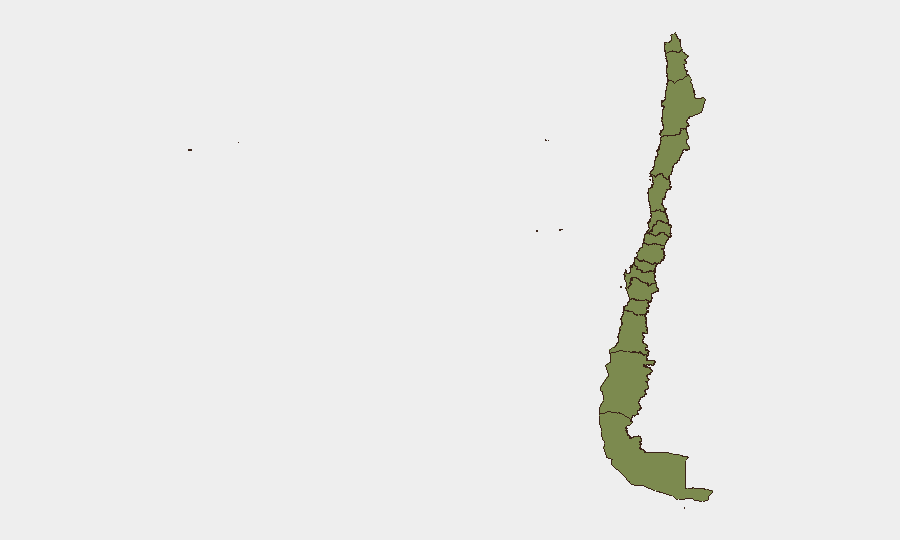
Situation Summary
Chile remains a low-threat environment globally (rank #106, composite score 2.5) with no confirmed security incidents, violent crime, protests, or infrastructure disruptions reported in the past 24–48 hours. The country's overall stability trajectory is stable; routine crime and political discourse continue at baseline levels without escalation flags in open-source reporting. Risk concentrations are heavily skewed toward Coquimbo Region (score 31.8), which accounts for the majority of tracked threat events, while all other regions remain substantially lower-risk (1.8–5.4 range).
Key Developments
No confirmed security incidents, protests, civil unrest, or infrastructure disruptions were reported in Chile during 27–28 June 2026 in available open-source intelligence feeds, major news outlets, or social media monitoring. Current intelligence position reflects a quiet operational period with no events meeting incident-reporting thresholds. For duty-of-care and asset-protection teams, this means no immediate tactical alerts; however, absence of reported events does not eliminate baseline threats (petty crime, vehicle theft, localized gang activity in urban centers) that persist outside major incident tracking.
Highest-Risk Areas
Coquimbo Region dominates the threat landscape with a composite risk score of 31.8—more than five times higher than Santiago Metropolitan Region (5.4) and 17 times higher than all other tracked regions (1.8 each). This concentration suggests that the majority of GeoBit's 41 tracked events in Chile are geographically anchored to Coquimbo, likely reflecting organized crime activity, resource-extraction disputes, or gang presence in that region. Santiago Metropolitan Region represents the secondary concentration (5.4), reflecting typical metropolitan-area crime and protest risk common to large urban centers. All remaining regions—Valparaiso, Antofagasta, Atacama, Aysen, Los Lagos, Magallanes, O'Higgins, Maule, Nuble, and Biobio—are at parity (1.8), suggesting distributed low-level baseline risk without geographic flashpoints.
How GeoBit Would Assist
Security teams with personnel or assets in Chile should deploy AOI (Area-of-Interest) Monitoring & Early Warning on Coquimbo Region and Santiago's key business districts to detect real-time protest, crime, or conflict signals with persistent alerting. Intel Sweep and multi-language OSINT fusion across Chilean national media, police broadcasts, and geofenced social media will provide 24–48-hour advance notice of emerging incidents before they reach international newsflow. GIS & Spatial Analysis and alternative routing/network analysis enable rapid contingency planning should security conditions degrade in high-risk zones, allowing on-the-ground teams to adjust travel, supply chains, or operations proactively.
7-Day Outlook
No escalation drivers are currently visible in the open-source space; Chile's near-term trajectory remains stable barring unexpected external shocks (e.g., regional labor strikes, climate disasters, or major crime events in Coquimbo). Security teams should maintain baseline alerting and continue routine monitoring of Coquimbo and Santiago; the absence of current incidents does not reduce structural risk in those regions. Recommend refresh of contingency protocols and geofenced monitoring every 48–72 hours or upon alerting.
Highest-Risk Areas — Ranked
| # | State / Region | Risk |
|---|---|---|
| 1 | Coquimbo Region | 31.8 |
| 2 | Santiago Metropolitan Region | 5.4 |
| 3 | Valparaiso Region | 1.8 |
| 4 | Antofagasta Region | 1.8 |
| 5 | Atacama Region | 1.8 |
| 6 | Aysen del General Carlos Ibanez del Campo Region | 1.8 |
| 7 | Los Lagos Region | 1.8 |
| 8 | Magallanes and Chilean Antarctica Region | 1.8 |
| 9 | O'Higgins Region | 1.8 |
| 10 | Maule Region | 1.8 |
| 11 | Nuble Region | 1.8 |
| 12 | Biobio Region | 1.8 |
Sources
Previous Daily Briefs
A new Chile brief is written every day — each with its own risk map and downloadable CSV. Here's the last week; use the calendar to go further back.
📅 Browse every day by calendar →
Highlighted days have a brief. Tap a day for that day's map & analysis, or “csv” for that day's dataset ($5).