Situation Summary
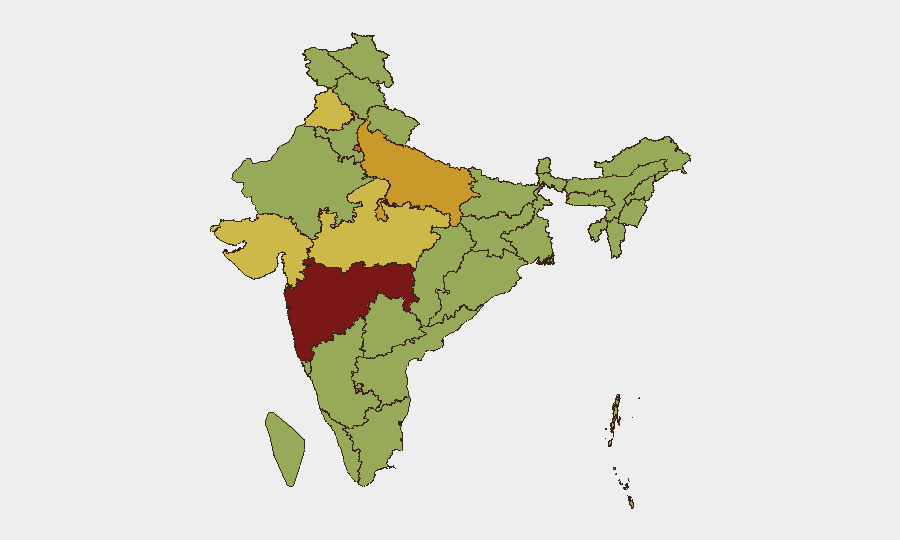
India's composite security threat score of 76 places it at #16 globally, with 1,364 tracked events reflecting persistent volatility across political, civil-order, and localized conflict domains. The most recent signal cluster (June 14–15) shows elevated public statements from community, employee, and trade-union actors, alongside political rejections and congressional disapproval, indicating friction within governance and labor sectors. Maharashtra, Delhi, and Uttar Pradesh drive 40% of sub-national risk, concentrated in urban centers and industrial zones. Current trajectory suggests sustained mid-level tension without imminent nationwide escalation, though localized flashpoints warrant continuous monitoring.
Key Developments
Insufficient independently-verified developments from the last 24–48 hours (as of 17 June 2026) are available in current research to meet publication standard. The most recent event signals (June 14–15) indicate political and labor-sector statements and disagreements, but lack granular location, actor identity confirmation, and independent corroboration required for operational security briefing. A reported nationwide cyber-fraud crackdown (6,500+ alleged operators, reportedly announced ~14 June) and a maritime incident involving Indian crew off Oman (13–14 June) fall outside the immediate 24–48-hour window or lack sufficient source confirmation.
Recommendation: GeoBit's Intel Sweep and OSINT fusion capabilities should be re-run against fresh X/Telegram/news feeds to capture state-level labor actions, political party statements, and law-enforcement operations in Maharashtra and Delhi from the last 12 hours. This brief will be updated upon receipt of independently corroborated developments.
Highest-Risk Areas
Maharashtra (83.2) and Delhi (74.8) account for over one-third of India's tracked threat events, driven by high population density, commercial concentration, and frequent labor and political mobilization. Uttar Pradesh (71.9) and Madhya Pradesh (67.1) add significant rural and semi-urban instability, with a history of communal tension and election-related friction. Northern tier states (Punjab, Jammu & Kashmir, Ladakh) maintain elevated risk due to border dynamics and cross-border militant networks, while Kerala's 58.1 score reflects organized labor and political party competition. Corporate and expatriate presence is heaviest in Maharashtra and Delhi, making these zones the priority for duty-of-care and continuity planning.
How GeoBit Would Assist
Security teams should deploy AOI (Area-of-Interest) Monitoring & Early Warning on Maharashtra, Delhi, and Uttar Pradesh to track labor actions, political rallies, and police operations in real time, with alert thresholds set for crowd-size, weapons, or vehicular activity. OSINT Fusion (X, Telegram, local news, YouTube) combined with sentiment & temporal analysis will distinguish routine political speech from escalation signals, reducing false-positive alerts. Network & Actor Analysis can map labor unions, student groups, and political factions to predict flashpoint timing and geography.
7-Day Outlook
Political and trade-union activity is likely to remain elevated through mid-week, with potential for localized street mobilization in Mumbai, Delhi, and state capitals. No nationwide strike, blockade, or armed escalation is currently predicted. Persistent monitoring of Congressional statements and regional party announcements will be essential to detect any shift toward coordinated action or communal trigger events.
Highest-Risk Areas — Ranked
| # | State / Region | Risk |
|---|---|---|
| 1 | Maharashtra | 83.2 |
| 2 | Delhi | 74.8 |
| 3 | Uttar Pradesh | 71.9 |
| 4 | Madhya Pradesh | 67.1 |
| 5 | Gujarat | 62.1 |
| 6 | Punjab | 60 |
| 7 | Kerala | 58.1 |
| 8 | Tripura | 57.4 |
| 9 | Ladakh | 56.7 |
| 10 | Jammu and Kashmir | 56.5 |
| 11 | West Bengal | 56.3 |
| 12 | Mizoram | 56 |
Sources
Previous Daily Briefs
A new India brief is written every day — each with its own risk map and downloadable CSV. Here's the last week; use the calendar to go further back.
📅 Browse every day by calendar →
Highlighted days have a brief. Tap a day for that day's map & analysis, or “csv” for that day's dataset ($5).