Situation Summary
Nepal remains a low-to-moderate security environment globally (rank #73), with a composite threat score of 12 across 35 tracked events. The security picture is dominated by Bagamati Province (Kathmandu Valley region), which accounts for the overwhelming majority of recorded risk (31.4 of 35.2 aggregate points). No major new violent incidents, civil unrest, or infrastructure disruptions have been corroborated in the last 24–48 hours; recent open-source activity reflects ongoing political tensions around government communications policy and youth-driven social movements, but these are not documented as acute security events in the specified timeframe. The trajectory remains stable, with routine governance and diplomatic activity dominating the news cycle.
Key Developments
No corroborated major security incidents have been time-stamped and cross-checked for the 24–48 hour window ending 2026-06-18. Open-source and social-media reporting available does not yield developments meeting verification and recency criteria for operational inclusion. The most recent GEOBIT event signals (dated 2026-06-15 and 2026-06-17) include public statements, administrative investigations, and diplomatic rejections (e.g., Interpol-related), but underlying incident narratives lack sufficient granularity and location specificity to brief as discrete, actionable developments. Teams should note that social-media commentary circulating on X and Telegram referencing past protests and media restrictions (e.g., from September 2025 or earlier in 2026) is being reshared in the current cycle but does not represent new incidents; careful temporal cross-checking is required to avoid treating historical narrative as current threat.
Highest-Risk Areas
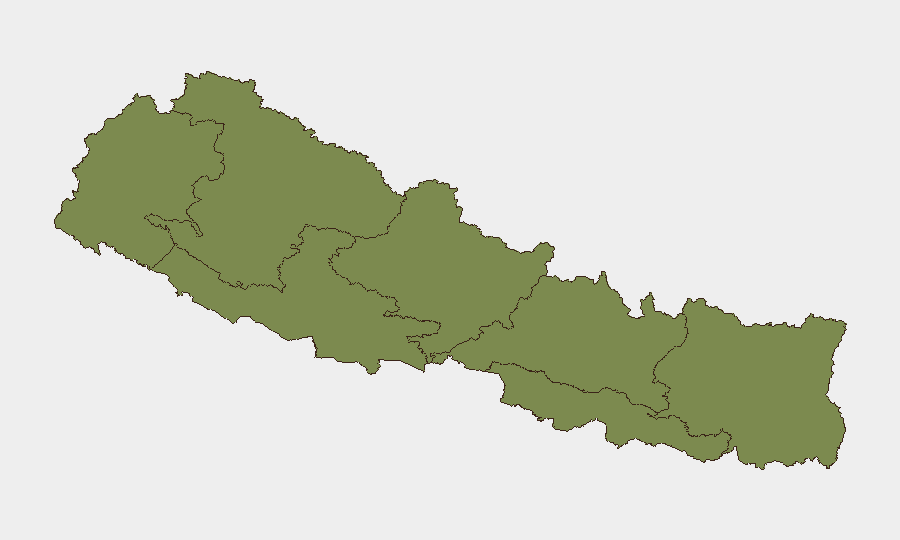
Bagamati Province—primarily the Kathmandu Valley and administrative center—drives 89% of Nepal's recorded composite risk (31.4 of 35.2). This concentration reflects density of government institutions, international presence, political activity, and historical protest/demonstration activity. The remaining six provinces show near-parity at 1.4–4.4 risk scores, indicating either lower incident frequency or lower consequence. For corporate and NGO operations with Kathmandu-based offices, staff, or supply chains, Bagamati Province remains the primary focus of duty-of-care monitoring. Peripheral and border regions (Gandaki, Karnali, Sudurpashchim) carry minimal documented risk but merit contextual awareness, particularly if operations involve cross-border movement or remote settlements.
How GeoBit Would Assist
Security teams managing personnel or assets in Nepal should deploy AOI (Area-of-Interest) Monitoring & Early Warning on Kathmandu Valley and key transportation nodes to detect civil unrest, protest activity, or infrastructure disruption in near-real time. Intel Sweep and multi-language OSINT fusion across social media, local news, and government sources will surface political and administrative developments (media bans, youth movements, border tensions) before they escalate to operational risk. Routing & Network Analysis capabilities enable pre-planned alternative routes for staff movement in the event of sudden road closures or demonstrations in Bagamati Province.
7-Day Outlook
No significant escalation is forecast for the next seven days based on current signals and open-source trajectory. Political and administrative tensions remain non-violent. Teams should monitor for any renewal of youth-led protest campaigns or shifts in government communications policy, as these have historically driven short-term mobility and access disruptions in Kathmandu; GeoBit's persistent monitoring will provide 24–48 hour lead time if such movements gain momentum.
Highest-Risk Areas — Ranked
| # | State / Region | Risk |
|---|---|---|
| 1 | Bagamati Province | 31.4 |
| 2 | Gandaki Province | 4.4 |
| 3 | Sudurpashchim Province | 1.4 |
| 4 | Karnali Province | 1.4 |
| 5 | Lumbini Province | 1.4 |
| 6 | Koshi Province | 1.4 |
| 7 | Madhesh Province | 1.4 |
Sources
Previous Daily Briefs
A new Nepal brief is written every day — each with its own risk map and downloadable CSV. Here's the last week; use the calendar to go further back.
📅 Browse every day by calendar →
Highlighted days have a brief. Tap a day for that day's map & analysis, or “csv” for that day's dataset ($5).