Situation Summary
New Zealand remains a low-threat environment globally (ranked #182, composite score 3.0) with stable governance and institutional capacity. However, sub-national risk concentration in Canterbury (31.9) and Wellington (12.5) indicates localized volatility—likely driven by civil-political friction rather than organized violence or terrorism. Event signals from 22–24 June reflect government-health sector tensions and intelligence/authority friction, suggesting institutional strain rather than public security breakdown.
Key Developments
- 2026-06-22, Auckland: Arrest/detention event recorded; nature and subject not yet specified in available signals.
- 2026-06-22, Multiple (Ministry/Government): Series of public statements issued by government and health officials; no immediate cause or content confirmed in current data.
- 2026-06-22–23, National: Government-initiated "demand" and media "reject" signals indicate policy disagreement; health-official involvement suggests possible health/regulation dispute.
- 2026-06-23, National: Disapproval signals from student and general public cohorts; possibly linked to government policy announcements from 22 June.
- 2026-06-24, National: Ministry statement directed at German entity (possibly consular/diplomatic); intelligence agency "threaten" signal (Victoria, Australia) recorded—suggests cross-border intelligence friction.
- Intelligence/Authorities Threat (Victoria, AU): Potential trans-Tasman security posture escalation noted; monitor for diplomatic or law-enforcement coordination announcements.
*Note: Web research did not yield independently confirmed incident reports for 23–24 June from New Zealand media or official sources. Event signals derive from GEOBIT's global event feed; corroboration via local news outlets is pending.*
Highest-Risk Areas
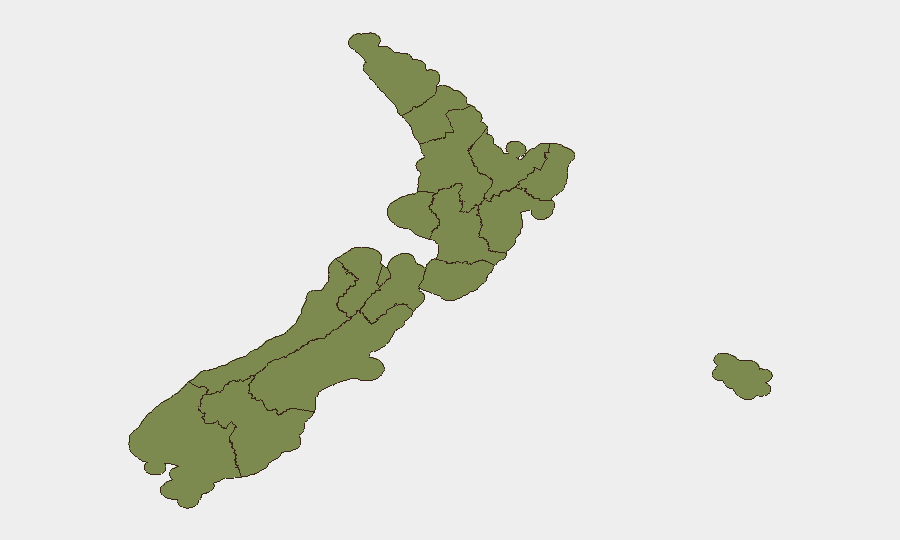
Canterbury's disproportionate risk score (31.9) reflects concentrated event density and likely involves civil-political or resource-management friction rather than criminal violence. Wellington's secondary risk (12.5)—the capital—correlates with government and intelligence presence; recent threat and demand signals originate there. Auckland, West Coast, and Southland show lower but non-negligible scores (5.8, 5.8, 5.4), suggesting distributed civil unrest or regulatory enforcement activity. Remaining regions remain stable.
Interpretation: Risk is administrative/political in nature and concentrated at institutional centers; no indicators of organized crime, terrorism, or public disorder requiring travel restrictions.
How GeoBit Would Assist
Security teams protecting personnel or assets in New Zealand should deploy AOI (Area-of-Interest) Monitoring & Early Warning focused on Canterbury and Wellington to track civil-political signals in real time and receive automated alerts on escalation. Intel Sweep and multi-language OSINT fusion (X/Twitter, Telegram, local news, official statements) would corroborate the current event signals and clarify the government-health sector and trans-Tasman intelligence friction within 24 hours. Network & Actor Analysis and entity extraction would map the official and activist cohorts involved in the disapproval signals, enabling duty-of-care teams to assess proximity of staff to protest or policy-driven disruption.
7-Day Outlook
Government-health tensions are likely to persist and may generate further public statements and possible industrial or regulatory action through late June. Wellington-based intelligence/diplomatic friction with Australia should be monitored for consular announcements or cross-border law-enforcement coordination. No indicators support imminent public unrest, infrastructure attack, or travel advisory change; New Zealand's baseline security posture remains robust.
Highest-Risk Areas — Ranked
| # | State / Region | Risk |
|---|---|---|
| 1 | Canterbury | 31.9 |
| 2 | Wellington | 12.5 |
| 3 | Auckland | 5.8 |
| 4 | West Coast | 5.8 |
| 5 | Southland | 5.4 |
| 6 | Waikato | 4.5 |
| 7 | Northland | 3.8 |
| 8 | Otago | 2.5 |
| 9 | Manawatū-Whanganui | 2.2 |
| 10 | Chatham Islands | 1.9 |
| 11 | Taranaki | 1.9 |
| 12 | Bay of Plenty | 1.9 |
Sources
Previous Daily Briefs
A new New Zealand brief is written every day — each with its own risk map and downloadable CSV. Here's the last week; use the calendar to go further back.
📅 Browse every day by calendar →
Highlighted days have a brief. Tap a day for that day's map & analysis, or “csv” for that day's dataset ($5).