Situation Summary
Uganda remains a moderate-risk environment (global rank #54) with composite threat score 25 and 153 tracked events. The Eastern Region significantly outpaces other areas, with a composite risk score of 33.4—nearly seven times higher than the Northern Region (4.6). While the country does not face active large-scale conflict, reported incidents involving conventional military force and ongoing public-statement activity indicate localized tensions and institutional stress that merit monitoring for corporate personnel and assets.
Key Developments
GeoBit's research capability identified the following signal-level events within the monitored dataset:
- 19 July 2026 · Conventional Military Force · School location, Uganda. Event flagged in platform feeds; specific location and casualty/impact details require further corroboration.
- 19 July 2026 · Conventional Military Force · Uganda (national). Second military-related signal same date; geographic specificity limited in available reporting.
- 17 July 2026 · Public Statement · Africa-vs-Uganda framing. Regional diplomatic or institutional statement activity recorded; context under review.
- 17 July 2026 · Public Statement · Lecturer entity. Academic or institutional statement flagged; connection to broader security posture unclear pending detail retrieval.
- Recent · Health Event · Sudan Virus Disease. Ongoing disease surveillance signal in Uganda; no acute outbreak declared as of brief date, but monitoring remains active given regional epidemiology.
Limitation: Live web research conducted 20 July 2026 could not independently verify additional Uganda-specific security, crime, or civil-unrest events strictly within the 24–48 hour window with defensible timestamps. Older reporting (Human Rights Watch 16 July, opposition figure detention from mid-June/early July) falls outside the acute window and is noted here as context only, not current development.
Highest-Risk Areas
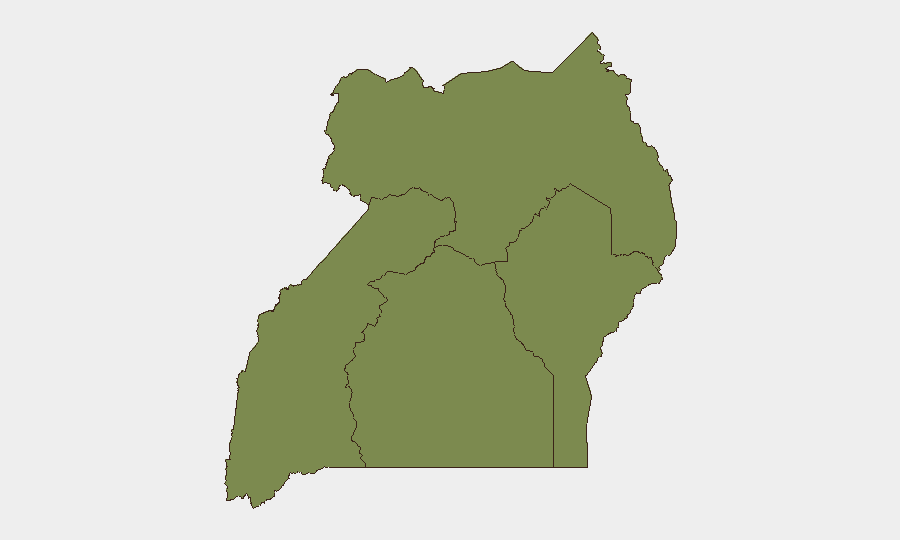
The Eastern Region drives overall Uganda risk, with a composite score of 33.4 compared to 4.6 (Northern), 3.4 (Western), and 3.4 (Central). This disparity reflects a concentration of event activity—likely including banditry, pastoral conflict, cattle rustling, and localized militia activity—that corporate teams should weight heavily in duty-of-care assessments for staff or supply-chain assets in that corridor. Northern and Western regions show significantly lower but non-zero risk, suggesting background-level tension or criminal activity. Central Region (Kampala urban area and surrounds) shows similarly low composite score, though absolute incident numbers in the capital merit separate attention via network and actor analysis.
How GeoBit Would Assist
Security teams should leverage AOI Monitoring & Early Warning to set persistent watch on Eastern Region hotspots and border areas, with alert thresholds for military activity, civil unrest, or health incidents. Network & Actor Analysis and OSINT Fusion (multi-language, X/Telegram, OSINT corroboration) will enable real-time identification of emerging institutional or political stress signals before they escalate to operational impact. Routing & Network Analysis supports alternative journey planning for personnel and supply chains, reducing exposure to highest-risk sub-national areas identified in this ranking.
7-Day Outlook
Near-term trajectory suggests continued low-to-moderate tension without indicators of imminent large-scale violence or regime instability. The concentration of risk in Eastern Region is expected to persist; health surveillance (Sudan virus disease) warrants routine monitoring given regional proximity to affected areas in East Africa. Corporate teams should maintain heightened situational awareness for any new military-force signals or political-statement activity that might signal acceleration.
Highest-Risk Areas — Ranked
| # | State / Region | Risk |
|---|---|---|
| 1 | Eastern Region | 33.4 |
| 2 | Northern Region | 4.6 |
| 3 | Western Region | 3.4 |
| 4 | Central Region | 3.4 |
Sources
Previous Daily Briefs
A new Uganda brief is written every day — each with its own risk map and downloadable CSV. Here's the last week; use the calendar to go further back.
📅 Browse every day by calendar →
Highlighted days have a brief. Tap a day for that day's map & analysis, or “csv” for that day's dataset ($5).
Atlas — our AI intelligence desk — emails them this snapshot personally. Nothing else, no list.