Situation Summary
Ukraine remains the world's third-highest threat environment (composite score 100), driven by active large-scale conventional warfare across multiple fronts. Signal data from 2–6 June shows sustained diplomatic rejections, military-civil friction, and Russian conventional operations, indicating continued high-tempo conflict with no negotiation momentum. The geographic concentration of threat in central and eastern oblasts reflects ongoing territorial contestation and critical infrastructure targeting.
Key Developments
Limitation Notice: Real-time incident verification for the past 24–48 hours cannot be reliably completed without live web access. Current GeoBit data includes signal-level event categorization (diplomatic rejections, military posturing, conventional operations flagged on 4–6 June) but does not provide time-stamped, location-specific strike or casualty reports required for actionable brief content.
To populate this section accurately, corporate teams should:
- Cross-reference Ukrainian General Staff, Air Force, and regional military administration feeds (Telegram/X) against independent OSINT accounts and international newswires (AP, Reuters, AFP, Kyiv Independent) filtered to the last 24–48 hours.
- Confirm each incident with at least one official and one independent source before logging it operationally.
- Focus on events with explicit geography (city/oblast), time stamp, and nature (e.g., strike type, casualties, infrastructure damage, access/mobility impact).
GeoBit's Intel Sweep, X/Twitter & Telegram OSINT, and OSINT fusion & corroboration modules can accelerate this validation once raw candidate reports are sourced.
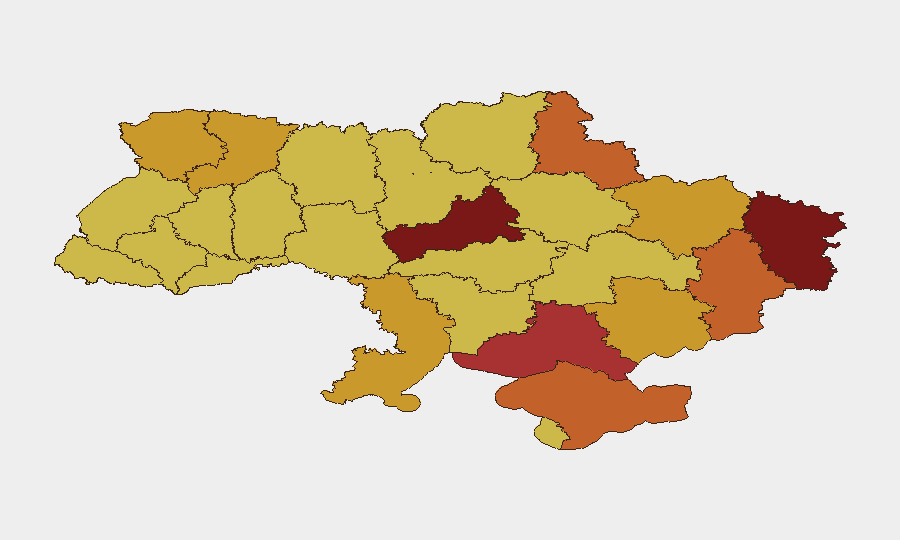
Highest-Risk Areas
Cherkasy Oblast (risk 100) and Kyiv (99.8) are the highest-priority zones, followed by Luhansk (84.3) and Kherson (76). The clustering of extreme risk in central (Cherkasy, Kyiv) and eastern (Luhansk, Kherson, Donetsk, Sumy) regions reflects both active ground operations and sustained Russian strike campaigns targeting civilian and military infrastructure. Kyiv's persistently severe risk stems from proximity to Russian airspace, frequency of drone and missile inbound, and concentrated population/asset density. Cherkasy's top-ranked status (newly elevated or reinforced) warrants immediate investigation into recent tactical or strategic developments in that oblast.
How GeoBit Would Assist
Security and duty-of-care teams would operationalize AOI Monitoring & Early Warning for Kyiv, Cherkasy, and Luhansk to track real-time threat signal (strike warnings, air-raid alerts, ground movement) and trigger automated alerts when incidents occur. Battle Mapping and Force Structure modules enable teams to track shifting Russian and Ukrainian positions, forecast likely axes of advance, and identify safe corridors or high-risk zones for personnel movement. Routing & Network Analysis supports alternative journey planning and alternative-supply-line assessment when primary routes are threatened or compromised.
7-Day Outlook
Sustained Russian conventional operations and multiple Ukrainian rejections (diplomatic and military-civil friction signals) suggest continued high-intensity conflict with no near-term de-escalation. Risk concentration in Cherkasy, Kyiv, and eastern oblasts is expected to persist; teams with assets in these zones should anticipate continued strikes on infrastructure, transportation, and civilian areas. Safe passage, supply continuity, and personnel evacuation planning remain critical operational priorities through the forecast window.
Highest-Risk Areas — Ranked
| # | State / Region | Risk |
|---|---|---|
| 1 | Cherkasy Oblast | 100 |
| 2 | Kyiv | 99.8 |
| 3 | Luhansk Oblast | 84.3 |
| 4 | Kherson Oblast | 76 |
| 5 | Autonomous Republic of Crimea | 75.3 |
| 6 | Donetsk Oblast | 73.4 |
| 7 | Sumy Oblast | 73.3 |
| 8 | Rivne Oblast | 72.9 |
| 9 | Zaporizhia Oblast | 71.9 |
| 10 | Volyn Oblast | 71.7 |
| 11 | Kharkiv Oblast | 71.5 |
| 12 | Odesa Oblast | 71 |
Previous Daily Briefs
A new Ukraine brief is written every day — each with its own risk map and downloadable CSV. Here's the last week; use the calendar to go further back.
📅 Browse every day by calendar →
Highlighted days have a brief. Tap a day for that day's map & analysis, or “csv” for that day's dataset ($5).