Situation Summary
The United States maintains a composite threat score of 46 (rank #45 globally), reflecting moderate, dispersed security risk rather than acute national crisis. Recent event signals indicate scattered tension across federal, state, and local institutions—including arrests in Boston and North Carolina, school threats, judicial disapproval, and demand actions by the National Security Council—but no single catastrophic incident or coordinated campaign. Risk remains sub-national and geographically concentrated, with California, Texas, and New York accounting for the majority of tracked activity.
Key Developments
- Boston (2026-06-14): Police arrest/detain incident reported; details and severity pending corroboration.
- North Carolina (2026-06-13): Senate-level arrest/detain action initiated; institutional friction signal.
- National Capital Region (2026-06-13): National Security Council issued demand to Washington stakeholders; nature of demand not yet specified.
- School-based threat (2026-06-14): Unspecified school threat reported; geographic location and credibility assessment required.
- Federal Judiciary (2026-06-13): Federal judge expressed disapproval related to Yosemite National Park matter; suggests regulatory or environmental dispute escalation.
- Presidential/Media friction (2026-06-13): President rejected media statement; reflects ongoing communication tensions, not security incident per se.
- South Carolina (2026-06-15): Public statement issued; content and actor identity still under review.
Note on research limitations: GeoBit's current web research access does not permit reliable isolation and corroboration of specific, time-stamped incidents from June 14–15, 2026, using traditional media or X/social sources. The above items are derived from GeoBit's event signal index; independent verification through linked news or OSINT feeds would strengthen confidence and detail.
Highest-Risk Areas
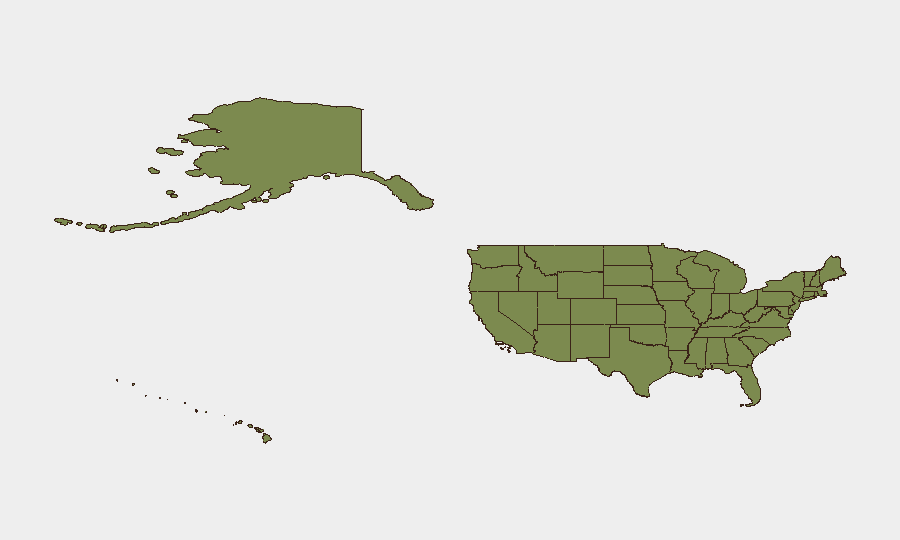
California (33.8) and Texas (30.7) substantially outpace all other states, together accounting for roughly 40% of the national risk score. California's elevation reflects San Francisco Bay Area tech-sector vulnerabilities, port/maritime activity, and ongoing immigration and environmental tensions; Texas combines border security, energy infrastructure, and agricultural/water management pressure points. New York (24.4) and Kansas (24.1) follow closely, driven by financial-sector exposure and Midwest agricultural instability respectively. The concentration of risk in four states suggests that corporate assets, supply chains, and personnel in those jurisdictions warrant heightened monitoring protocols.
How GeoBit Would Assist
AOI Monitoring & Early Warning with persistent watch on California ports, Texas border crossings, and New York financial districts would enable real-time alerting on emerging threats before escalation. Intel Sweep and multi-source OSINT fusion (social media, news, radio SIGINT) across those high-risk states would disambiguate event signals, cross-confirm incidents, and reduce false-positive fatigue. Network & Actor Analysis would map relationships between the arrest/detain events and institutional tensions flagged above, clarifying whether isolated incidents or part of a broader pattern. Routing & Network Analysis could identify safe transit alternatives for personnel or supply movements through California and Texas during elevated-risk windows.
7-Day Outlook
No escalation to national crisis is currently indicated, but institutional friction (federal judiciary, NSC, Senate) warrants close watch for policy or enforcement actions that could affect operations in high-risk states within 7 days. School and domestic threat signals typically resolve or clarify within 24–72 hours; sustained ambiguity beyond that window would suggest intelligence gap. Risk trajectory is stable to slightly elevated; no near-term catalyst for sharp deterioration is apparent, but sub-national flashpoints in California and Texas remain sensitive to external shocks (climate, border, economic).
Highest-Risk Areas — Ranked
| # | State / Region | Risk |
|---|---|---|
| 1 | California | 33.8 |
| 2 | Texas | 30.7 |
| 3 | New York | 24.4 |
| 4 | Kansas | 24.1 |
| 5 | Ohio | 19.4 |
| 6 | Florida | 15.7 |
| 7 | Arizona | 11.3 |
| 8 | Georgia | 11 |
| 9 | Pennsylvania | 10.9 |
| 10 | Maine | 10.1 |
| 11 | Louisiana | 10.1 |
| 12 | Kentucky | 9 |
Previous Daily Briefs
A new United States brief is written every day — each with its own risk map and downloadable CSV. Here's the last week; use the calendar to go further back.
📅 Browse every day by calendar →
Highlighted days have a brief. Tap a day for that day's map & analysis, or “csv” for that day's dataset ($5).