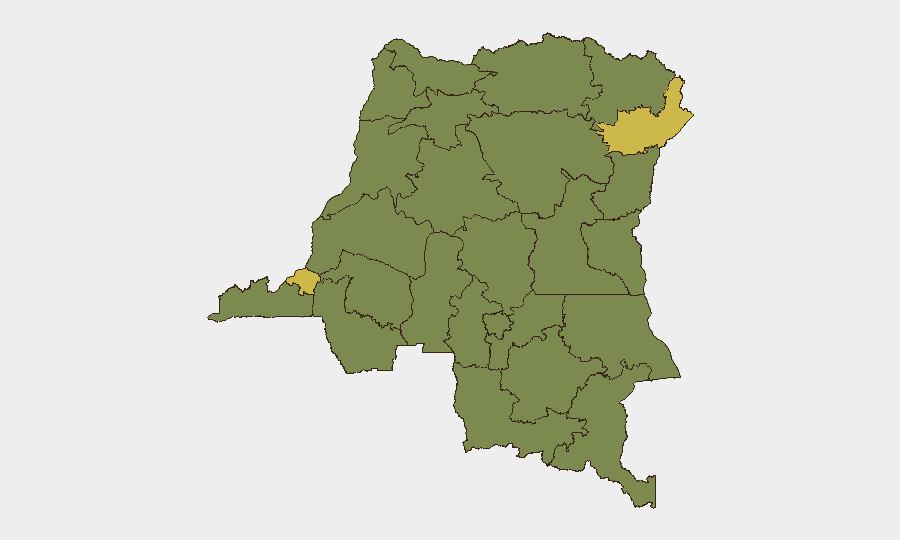
Situation Summary
DR Congo remains the 34th highest-threat country globally, with a composite threat score of 55.6 driven primarily by active civil conflict and 429 tracked security events. The security environment is marked by elevated risk in Ituri and Kinshasa (both scoring 68.9), with secondary volatility across the northern and central provinces. Recent developments include security lockdowns in major urban centers, signaling intensified state response to perceived threats but also reflecting underlying instability.
Key Developments
- Lubumbashi, Haut-Katanga (2026-06-09 to 2026-06-10): Security agencies arrested five additional Congolese nationals and imposed a 48-hour lockdown in DR Congo's second-largest city; streets were deserted and commercial activity suspended.
- Public statements and diplomatic activity (2026-06-10 to 2026-06-11): Recent official communications from MEDINA and statements involving the United States suggest evolving political or diplomatic dimensions to the security environment; full operational context remains under assessment.
- Regional spillover indicators (2026-06-09): Public statements from Chad and Nigeria suggest cross-border attention to DR Congo developments, consistent with historical patterns of regional destabilization flowing from Congolese instability.
- Ongoing civil conflict drivers: The primary threat ranking remains anchored in active civil war conditions, which continue to generate the majority of tracked security events (429 total) despite lack of major headline events in the immediate 24-hour window.
Highest-Risk Areas
Ituri and Kinshasa jointly represent the acute threat core, both scoring 68.9 and accounting for the majority of corporately relevant risk. Ituri's elevated score reflects continued armed-group activity and inter-communal violence in the eastern borderlands; Kinshasa's score indicates political, security-force, and protest-related volatility in the capital, directly affecting business continuity and staff safety. A secondary tier of provinces—Maniema, Sud-Ubangi, Équateur, and the Ueles—all score 38.9 and warrant monitoring for spillover or escalation. North Kivu, historically volatile, similarly registers 38.9, suggesting persistent but not currently acute destabilization.
How GeoBit Would Assist
Security and risk teams would deploy AOI Monitoring & Early Warning with persistent watch on Kinshasa, Ituri, and key logistics corridors to detect arrest campaigns, lockdowns, or protest escalation before they impact operations. Conflict & Military tracking and Network & Actor Analysis enable real-time mapping of armed-group disposition and state-security posture, critical for duty-of-care assessments. Routing & Network Analysis supports contingency planning by identifying alternative transit routes around high-risk zones; multi-language OSINT and sentiment analysis on local media, radio SIGINT, and social platforms provide early warning of political or security-force shifts before they become operational emergencies.
7-Day Outlook
The security environment is likely to remain volatile but not acutely destabilized in the immediate term. Kinshasa's lockdown posture and ongoing arrest activity suggest heightened state security measures that may persist or expand; correspondingly, protest or public-order incidents may surface with short notice. Ituri and the eastern conflict zones are expected to continue generating low-level incidents and displacement, with risk of escalation if cross-border or inter-group dynamics shift. Organizations with personnel or assets in-country should assume elevated vigilance protocols remain necessary.
Highest-Risk Areas — Ranked
| # | State / Region | Risk |
|---|---|---|
| 1 | Ituri | 68.9 |
| 2 | Kinshasa | 68.9 |
| 3 | Maniema | 38.9 |
| 4 | Sud-Ubangi | 38.9 |
| 5 | Équateur | 38.9 |
| 6 | Nord-Ubangi | 38.9 |
| 7 | Mongala | 38.9 |
| 8 | Lower Uele | 38.9 |
| 9 | Tshopo | 38.9 |
| 10 | Tshuapa | 38.9 |
| 11 | Upper Uele | 38.9 |
| 12 | North Kivu | 38.9 |
Sources
Previous Daily Briefs
A new DR Congo brief is written every day — each with its own risk map and downloadable CSV. Here's the last week; use the calendar to go further back.
📅 Browse every day by calendar →
Highlighted days have a brief. Tap a day for that day's map & analysis, or “csv” for that day's dataset ($5).