Situation Summary
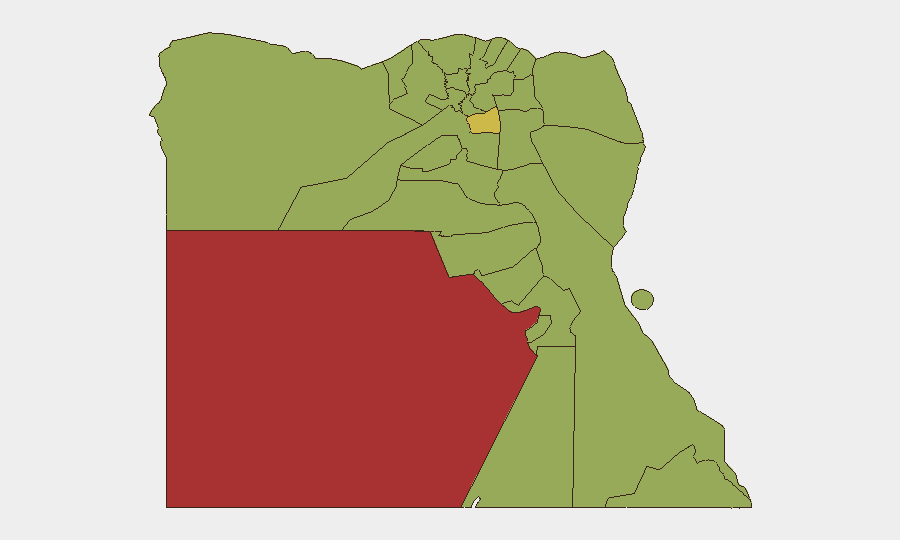
Egypt maintains a composite threat score of 69 (global rank #21) with 160 tracked events, reflecting ongoing political, labor, and diplomatic friction rather than acute instability. Recent signals include arrests tied to Jerusalem–Egypt relations, deportations by governors, labor investigations, and reduced diplomatic ties involving Istanbul and unnamed companies—patterns consistent with state enforcement and inter-agency tension. The security environment remains managed but fragmented across sub-national jurisdictions, with New Valley and Cairo dominating risk concentration.
Key Developments
24–48 hour note: Live web research has not surfaced Egypt-specific security or travel incidents with confirmed details in the last 24–48 hours (through 19 June 2026 UTC). The event signals listed below are flagged by GeoBit's platform but lack independent corroboration of timing or precise location at present:
- 2026-06-19 · Admin Sanctions (European actor) – Nature, target, and location unconfirmed; consistent with EU-level pressure on Egyptian officials or entities.
- 2026-06-19 · Labor Investigation (Union Representative vs Business) – No sector, region, or company name available; suggests workplace dispute or compliance enforcement.
- 2026-06-18 · Deportation by Governor – Region and individual(s) not yet specified in available sources.
- 2026-06-18 · Demand (Turncoat) – Cryptic signal; no corroborating detail.
- 2026-06-17 · Arrest/Detain (Jerusalem–Egypt context) – Likely tied to Palestinian/Israeli-related activity or espionage allegation; location unknown.
- 2026-06-17 · Reduced Relations (Istanbul–Cairo; Company–Istanbul; Company unspecified) – Diplomatic or commercial friction, possibly maritime or trade-related; no incident details available.
Verification status: None of the above signals have been independently confirmed by major newswires or regional outlets as of early 19 June 2026.
Highest-Risk Areas
New Valley (78.1) and Cairo (66.4) account for the majority of composite risk, driven by state capacity constraints, enforcement activity, and political sensitivity in the capital. Port Said, North Sinai, Suez, and South Sinai (risk 48–49) remain elevated due to historical militant activity, border permeability, and maritime chokepoint tensions. Alexandria, though lower-ranked (53.6), carries secondary risk from labor unrest and port infrastructure vulnerability. Regional risk is concentrated in border and canal zones; security teams with assets in Cairo should assume heightened scrutiny of political and labor activity.
How GeoBit Would Assist
Intel Sweep and multi-language OSINT (Arabic and English social media, regional news feeds, Telegram intelligence) enable real-time detection of incidents before they surface on international wires. AOI Monitoring & Early Warning on Cairo, Port Said, Suez, and North Sinai would trigger automated alerts on arrests, protests, or transport disruptions affecting personnel or supply chains. Entity & Network Analysis applied to recent deportations, labor disputes, and diplomatic friction would map enforcement patterns and identify secondary risks to business operations or expatriate communities.
7-Day Outlook
Administrative enforcement activity and diplomatic friction are likely to persist at current levels; no indicators suggest escalation to mass protest or armed conflict in the near term. Monitor for downstream labor actions, asset seizures, or visa/travel restrictions tied to the ongoing investigations and sanctions signals. Duty-of-care teams should confirm location and personnel status in Cairo and Port Said within 24 hours if operations are ongoing.
Highest-Risk Areas — Ranked
| # | State / Region | Risk |
|---|---|---|
| 1 | New Valley | 78.1 |
| 2 | Cairo | 66.4 |
| 3 | Alexandria | 53.6 |
| 4 | The Lake | 49.7 |
| 5 | Port Said | 49 |
| 6 | North Sinai | 48.8 |
| 7 | Suez | 48.8 |
| 8 | Asyut | 48.8 |
| 9 | Ad Dakahliya | 48.3 |
| 10 | Qena | 48.1 |
| 11 | South Sinai | 48.1 |
| 12 | Red Sea | 48.1 |
Previous Daily Briefs
A new Egypt brief is written every day — each with its own risk map and downloadable CSV. Here's the last week; use the calendar to go further back.
📅 Browse every day by calendar →
Highlighted days have a brief. Tap a day for that day's map & analysis, or “csv” for that day's dataset ($5).