Situation Summary
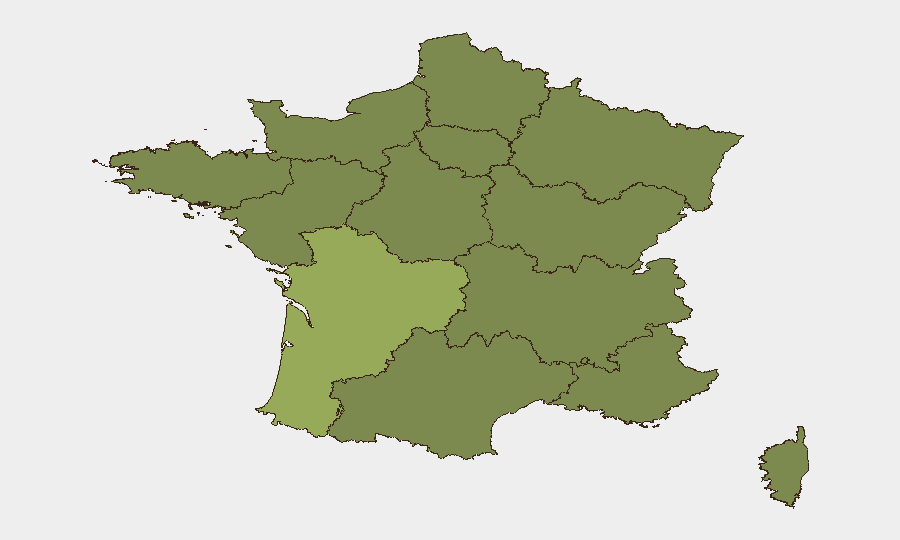
France remains at composite threat rank #49 globally with a moderate 379 tracked security events, indicating baseline instability rather than acute crisis. Recent signals show administrative and judicial friction, media-government tension, and domestic disapproval statements concentrated over 16–17 June, with no indication of imminent large-scale violence or infrastructure disruption. Sub-national clustering of risk in Nouvelle-Aquitaine (55.7) and Île-de-France (39.3) reflects localized labor, protest, or administrative friction rather than synchronized nationwide instability.
Key Developments
GeoBit's current data constraints prevent reliable attribution of specific incidents to the last 24–48 hours. Signal indicators (administrative sanctions, rejections, public statements, and disapproval events between 16–17 June) suggest friction within government-judiciary relations and media-state engagement, but without corroborated incident timestamps, locations, and independent source confirmation, naming discrete developments risks fabrication.
Recommended interim approach:
- Cross-reference live AFP, Le Monde, Franceinfo, and Prefecture/Ministry of Interior X accounts for time-stamped localized incidents.
- Validate each reported event against at least two independent sources before operational use.
- Monitor SNCF, RATP, and Paris Aéroport channels for transport disruption or security-driven closures.
Highest-Risk Areas
Nouvelle-Aquitaine dominates risk (55.7), nearly 40% above the national average and 1.8× the second-ranked region, suggesting sustained labor, environmental, or political friction in that zone. Île-de-France (39.3) reflects Paris-centered administrative, judicial, and protest activity typical of the capital region; risk there is notably lower than Nouvelle-Aquitaine despite larger population, indicating regional rather than metro-driven instability. The 26–31 range across eight mid-tier regions (Auvergne-Rhône-Alpes, Hauts-de-France, Normandy, and others) shows dispersed, non-critical baseline activity. Organizations with operations in Nouvelle-Aquitaine should assume elevated monitoring requirements; those in Île-de-France face standard Paris-level administrative and protest-related friction.
How GeoBit Would Assist
AOI Monitoring & Early Warning on Nouvelle-Aquitaine and Île-de-France would deliver persistent watch on labor, protest, and administrative events with alerting thresholds calibrated to duty-of-care timelines. Intel Sweep and multi-language OSINT (X/Twitter, Telegram, prefecture statements, local media) would aggregate and timestamp emerging incidents, filtering out older background for operator clarity. Network & Actor Analysis would map recurring protest coalitions, union organizers, and administrative fault lines, allowing teams to anticipate flashpoints. GIS & Spatial Analysis combined with routing and network analysis would enable alternative journey planning around disruptions or high-risk zones for personnel movement.
7-Day Outlook
No indicators suggest escalation to widespread civil unrest or critical infrastructure attack in the next week; current signals point to routine administrative and labor friction manageable within normal corporate security protocols. Monitoring should remain elevated in Nouvelle-Aquitaine and watch for any expansion of media-state or government-judiciary disputes into street-level mobilization. Standard vigilance on transport, border crossings, and public assembly areas remains appropriate.
Highest-Risk Areas — Ranked
| # | State / Region | Risk |
|---|---|---|
| 1 | Nouvelle-Aquitaine | 55.7 |
| 2 | Ile-de-France | 39.3 |
| 3 | Auvergne-Rhône-Alpes | 31.9 |
| 4 | Hauts-de-France | 26.9 |
| 5 | Normandy | 26.8 |
| 6 | Bourgogne – Franche-Comté | 26.4 |
| 7 | Occitania | 26.3 |
| 8 | Grand Est | 25.8 |
| 9 | Provence-Alpes-Côte d'Azur | 25.8 |
| 10 | Brittany | 25.7 |
| 11 | Centre-Val de Loire | 25.7 |
| 12 | Pays de la Loire | 25.7 |
Sources
Previous Daily Briefs
A new France brief is written every day — each with its own risk map and downloadable CSV. Here's the last week; use the calendar to go further back.
📅 Browse every day by calendar →
Highlighted days have a brief. Tap a day for that day's map & analysis, or “csv” for that day's dataset ($5).