Situation Summary
Somalia remains a high-volatility operating environment shaped by persistent Al-Shabaab insurgency, inter-clan tensions, and fragmented state capacity. The national composite threat score of 63 reflects active armed opposition and sporadic violence concentrated in pastoral and southern regions. While no single incident dominates the current reporting cycle, the threat landscape remains operationally dynamic with asymmetric risk distribution across sub-national territories.
Key Developments
Data Limitation Notice: GeoBit's live web research indicates that specific events from 22–23 June 2026 cannot be reliably confirmed at this time. Current event signals (21–22 June) flagged in the platform include conventional military posturing between media and Somali state actors, but without independent corroboration from regional news wires or verified social media sources, these cannot be attributed to concrete incidents with confirmed locations and casualty data.
To ensure duty-of-care accuracy, security teams should cross-reference regional news outlets (Garowe Online, Hiiraan Online, Shabelle Media, Radio Dalsan) and verified X/Twitter feeds from Somali journalists, ATMIS/AUSSOM, and UN Somalia for the most current 24–48 hour incident reports. Any confirmed incidents should include explicit timestamp, location (city/district/checkpoint), event type (IED, shooting, airstrike, etc.), and impact metrics before being operationalized in risk response.
Highest-Risk Areas
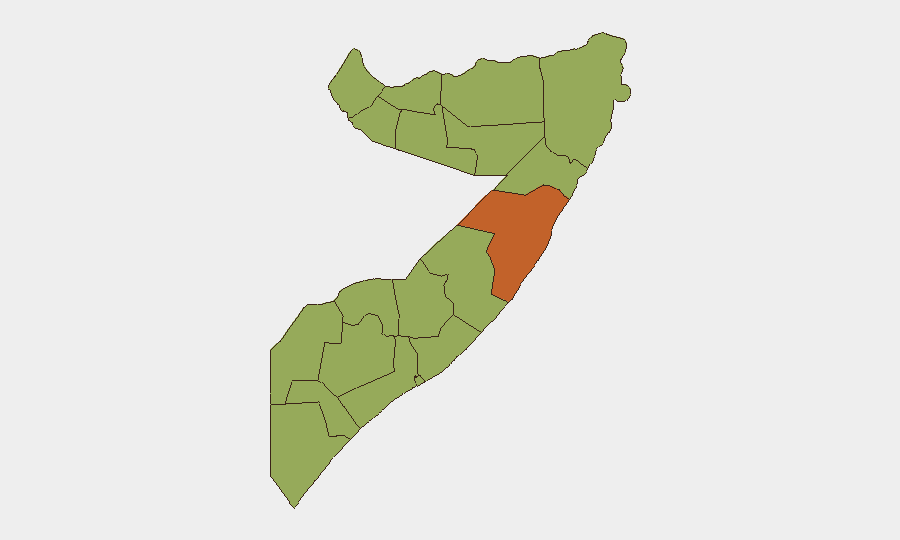
Mudug dominates the sub-national threat ranking (73.9), significantly outpacing all other regions and reflecting concentrated Al-Shabaab operational tempo and ungoverned space in the Galmudug state. The remaining high-risk states (Awdal, Woqooyi Galbeed, Gedo, Bakool, Bay, Middle Juba, Lower Shabelle, Sahil, Togdheer, Hiiraan, Middle Shebelle) cluster at 43.9, indicating a broad baseline of insurgent activity, clan conflict, and limited state security presence across southern and central Somalia.
Personnel and asset exposure should be weighted most heavily toward Mudug, where remoteness and weak administrative control create operational freedom for armed groups. Secondary-tier risk applies across the southern tier and central regions; even nominally "lower-risk" urban zones (e.g., parts of Mogadishu, Hargeisa) retain targeted-threat vectors from localized cell activity and criminal opportunism.
How GeoBit Would Assist
Security teams managing personnel or assets in Somalia should leverage AOI Monitoring & Early Warning on high-risk districts (Mudug, Lower Shabelle, Middle Juba) to receive real-time alerting on reported IEDs, armed clashes, and protest activity. OSINT Fusion & Corroboration (multi-language news aggregation, X/Twitter & Telegram scanning, entity extraction) enables continuous ingestion of Somali-language reporting and social signals that precede or accompany security incidents. Routing & Network Analysis supports alternative journey planning around known ambush corridors, checkpoints, and conflict flashpoints, reducing exposure during staffing rotations or supply runs.
7-Day Outlook
Near-term trajectory suggests sustained baseline insurgent pressure in Mudug and southern regions with no immediate de-escalation catalyst visible. Rainy season dynamics (June–September) may increase IED emplacement difficulty and reduce vehicle mobility in rural areas, though urban and coastal zones remain operationally exposed. Monitor regional diplomatic channels (IGAD, AU, bilateral mediations) for any shift in state-insurgent posture that could trigger localized security repositioning or increased checkpoint enforcement.
Highest-Risk Areas — Ranked
| # | State / Region | Risk |
|---|---|---|
| 1 | Mudug | 73.9 |
| 2 | Awdal | 43.9 |
| 3 | Woqooyi Galbeed | 43.9 |
| 4 | Gedo | 43.9 |
| 5 | Bakool | 43.9 |
| 6 | Bay | 43.9 |
| 7 | Middle Juba | 43.9 |
| 8 | Lower Shabelle | 43.9 |
| 9 | Sahil | 43.9 |
| 10 | Togdheer | 43.9 |
| 11 | Hiiraan | 43.9 |
| 12 | Middle Shebelle | 43.9 |
Sources
Previous Daily Briefs
A new Somalia brief is written every day — each with its own risk map and downloadable CSV. Here's the last week; use the calendar to go further back.
📅 Browse every day by calendar →
Highlighted days have a brief. Tap a day for that day's map & analysis, or “csv” for that day's dataset ($5).