Situation Summary
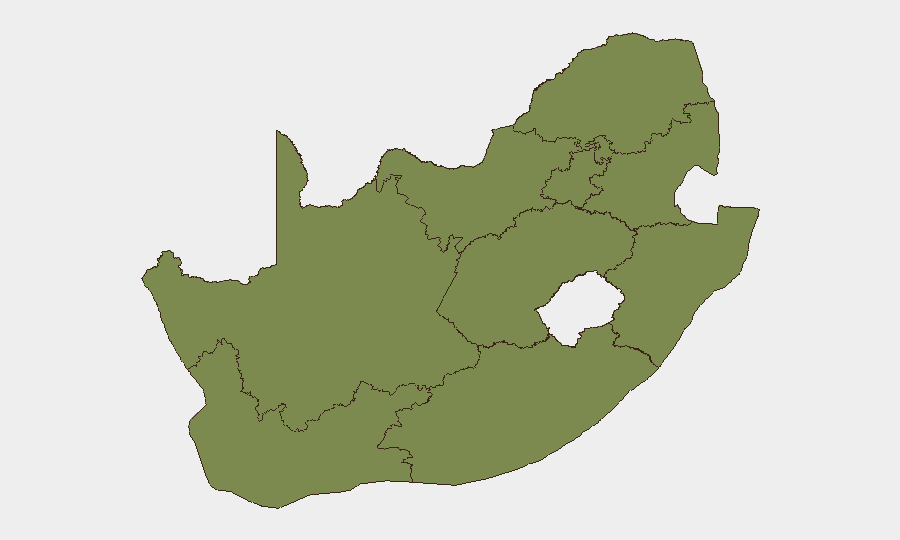
South Africa faces elevated security risk driven by sustained anti-migrant protests, sporadic xenophobic violence, and significant police and military deployments across major urban centres. The Free State, North West, and Gauteng provinces are experiencing the highest composite threat scores, with Gauteng—home to Johannesburg and major commercial hubs—recording a risk score of 26.2. Foreign nationals, particularly from West and Southern Africa, remain at heightened risk of assault or intimidation. The security posture is expected to remain strained as planned weekly protests continue and institutional capacity concerns surface.
Key Developments
- Johannesburg & Gauteng, 5–6 July: South African Police Service confirmed arrests linked to looting and opportunistic crime during security operations targeting unrest. Visible police patrols and rapid-response deployments remain active in major urban centres, with leave cancelled and resources redirected to protest sites and vulnerable areas.
- Nationwide, early July (ongoing): President Cyril Ramaphosa authorized deployment of 3,000+ military personnel to support police operations and bolster security. Troops are already deployed and active as of 5–6 July, indicating sustained government concern over escalation.
- Johannesburg, Soweto, Durban, 5–6 July: Anti-migrant protests organized around weekly schedules persist with reports of stone-throwing, intimidation, and vigilante activity targeting foreign nationals. Police resource allocation reflects expectation of recurring demonstrations.
- South Africa (Nigerian nationals), 6 July: Nigerian authorities reported two Nigerian citizens killed amid the surge in anti-migrant violence, prompting diplomatic concern and heightened attention to xenophobic incidents. The deaths are linked to current protest mobilizations and incitement campaigns.
- Multiple cities (Johannesburg, Pietermaritzburg, Mossel Bay), late June–early July (ongoing): Sporadic xenophobic attacks on migrants have persisted despite police presence, including assaults and stabbings targeting Mozambican, Malawian, and other foreign nationals. Fear and intimidation remain elevated in migrant communities.
- Nationwide (law enforcement & political establishment), 6 July: Former KwaZulu-Natal police commissioner alleged extensive criminal infiltration and corruption within law enforcement and political structures. The allegation, raised publicly in the last 24–48 hours, raises questions about institutional integrity and the operational capacity of security agencies to manage current unrest.
Highest-Risk Areas
Free State (32.5) and North West (29.9) provinces drive national risk scores, followed by Gauteng (26.2). Gauteng's elevated score reflects the concentration of commercial activity, dense urban centres (Johannesburg, Pretoria, Soweto), and the intersection of anti-migrant activism, police operations, and criminal opportunism. The Free State and North West show persistently high threat composites but with fewer tracked events, suggesting less media reporting or lower foreign national density; however, the risk scores warrant targeted monitoring. Eastern Cape (17.4) remains moderate risk. The remaining provinces register minimal tracked event activity and lower scores, indicating either lower underlying threat or reduced visibility.
How GeoBit Would Assist
Security teams should deploy AOI Monitoring & Early Warning on high-risk cities (Johannesburg, Durban, Pietermaritzburg) to track protest mobilizations, police deployments, and incident clusters in near-real time. Intel Sweep and X/Twitter & Telegram OSINT capabilities enable continuous tracking of protest organizer communications, incitement narratives, and emerging flashpoints. Routing & Network Analysis can support duty-of-care teams in identifying alternative travel corridors and safe zones for staff, while Sentiment & Temporal Analysis flags shifts in anti-migrant rhetoric and predictable protest windows (organized weekly schedules).
7-Day Outlook
Weekly anti-migrant protests are expected to continue, with military and police presence remaining elevated through mid-July. Risk of sporadic violence, looting, and targeted attacks on foreign nationals will persist in major urban areas, particularly Gauteng and Free State. Institutional questions about police integrity and capacity may slow response times and complicate coordination, prolonging the security strain.
Highest-Risk Areas — Ranked
| # | State / Region | Risk |
|---|---|---|
| 1 | Free State | 32.5 |
| 2 | North West | 29.9 |
| 3 | Gauteng | 26.2 |
| 4 | Eastern Cape | 17.4 |
| 5 | Limpopo | 2.4 |
| 6 | Northern Cape | 2.4 |
| 7 | Western Cape | 2.4 |
| 8 | Mpumalanga | 2.4 |
| 9 | KwaZulu-Natal | 2.4 |
Sources
Previous Daily Briefs
A new South Africa brief is written every day — each with its own risk map and downloadable CSV. Here's the last week; use the calendar to go further back.
📅 Browse every day by calendar →
Highlighted days have a brief. Tap a day for that day's map & analysis, or “csv” for that day's dataset ($5).
Atlas — our AI intelligence desk — emails them this snapshot personally. Nothing else, no list.