Situation Summary
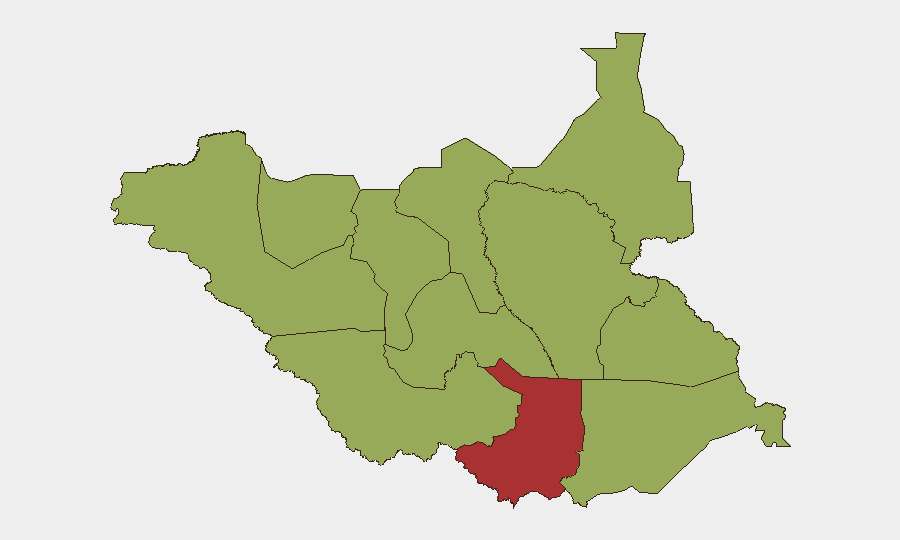
South Sudan remains in active civil conflict, ranking #15 globally with a composite threat score of 68 driven primarily by ongoing warfare and fragmentation. Central Equatoria State—home to the capital Juba—carries the highest sub-national risk (77.4) and represents the most volatile zone. Across the country, 97 tracked conflict events reflect persistent instability spanning military clashes, community violence, and banditry, with most regions outside the capital holding moderate-to-high risk scores (47.4). The conflict shows no signs of substantive de-escalation, and insecurity remains the dominant threat to personnel safety and asset protection.
Key Developments
Data Limitation Notice: Current open-source web and social-media monitoring (as of 23 June 2026, 24–48 hour window) has not yielded independently corroborated, time-stamped security incidents specific to South Sudan. Recent event signals in GeoBit's feed relate to South Korea, Nepal, China, and Turkey diplomatic activity—not South Sudan internal security. Recommend real-time X/Twitter monitoring on verified Juba-based journalists, UNMISS, UNOCHA, and regional wire services (Reuters, AFP, AP Africa) to capture evolving incidents in conflict zones (Jonglei, Lakes, Upper Nile, Unity) and main supply routes (Juba–Yei, Juba–Bor, Juba–Nimule). Priority watch categories: armed clashes, road ambushes, aid-worker targeting, and urban crime in state capitals.
Highest-Risk Areas
Central Equatoria State dominates the threat landscape (risk 77.4), reflecting ongoing military and factional violence in and around Juba, together with sporadic attacks on the Juba–Yei corridor. The remaining ten states and administrative areas cluster at 47.4, indicating sustained but more dispersed conflict: Upper Nile, Jonglei, Unity, and Lakes experience recurrent cattle-raiding, militia clashes, and LRA-linked activity; Northern Bahr el Ghazal and Warrap face communal tensions and armed groups; Western Equatoria and Eastern Equatoria remain vulnerable to cross-border spillover and banditry. The persistence of near-equal mid-range scores across periphery zones suggests fragmentation and lack of state control rather than a single geographic flashpoint—materially increasing the difficulty of route planning and personnel movement outside Juba.
How GeoBit Would Assist
Teams with personnel or assets in South Sudan should employ AOI Monitoring & Early Warning with persistent watch on highest-risk state capitals and critical supply corridors (Juba, Malakal, Bentiu, Wau, Yei, Bor) to detect emerging clashes or access blockages in real time. Routing & Network Analysis and GIS & Spatial Analysis capabilities enable dynamic assessment of safe transit windows and alternative movement routes as ground conditions shift. Intel Sweep and X/Twitter OSINT (cross-referenced against wire services) provide continuous situational updates on actor movements, displacements, and armed-group positioning—essential for duty-of-care decision-making on evacuation triggers and compound security posture.
7-Day Outlook
No major political or military inflection points are evident in the near term. Conflict intensity is expected to remain elevated and decentralized, with highest immediate risk in Central Equatoria and episodic flare-ups across Lakes, Jonglei, and Upper Nile. Personnel operating outside Juba should maintain heightened vigilance on road movement and reinforce compound security protocols; those in Juba should monitor political signals and crime trends closely for signs of rapid deterioration.
Highest-Risk Areas — Ranked
| # | State / Region | Risk |
|---|---|---|
| 1 | Central Equatoria | 77.4 |
| 2 | Upper Nile | 47.4 |
| 3 | Northern Bahr el Ghazal | 47.4 |
| 4 | Western Bahr el Ghazal State | 47.4 |
| 5 | Ruweng Administrative Area | 47.4 |
| 6 | Unity | 47.4 |
| 7 | Warrap | 47.4 |
| 8 | Lakes | 47.4 |
| 9 | Jonglei | 47.4 |
| 10 | Greater Pibor Administrative Area | 47.4 |
| 11 | Western Equatoria | 47.4 |
| 12 | Eastern Equatoria | 47.4 |
Sources
Previous Daily Briefs
A new South Sudan brief is written every day — each with its own risk map and downloadable CSV. Here's the last week; use the calendar to go further back.
📅 Browse every day by calendar →
Highlighted days have a brief. Tap a day for that day's map & analysis, or “csv” for that day's dataset ($5).