Situation Summary
The United States remains at composite threat rank #38 globally with 3,832 tracked events, reflecting elevated but fragmented risk across multiple threat categories rather than a coordinated nationwide crisis. California, Kansas, and Texas drive overall risk scores, with California's composite score (34) significantly outpacing other states. Event signals over the past 48 hours indicate scattered administrative, law-enforcement, and protest-related incidents without evidence of coordinated escalation or systemic breakdown.
Key Developments
- 2026-06-16 · New Jersey. Law enforcement rejection or dispute reported; specific incident details pending corroboration.
- 2026-06-16 · United Kingdom → Media (Admin Sanctions). UK administrative action against media entities; U.S. implications for news organizations or cross-border communications protocols require monitoring.
- 2026-06-16 · National (Governor). Gubernatorial disapproval statement issued; likely policy or personnel-related rather than acute security event.
- 2026-06-16 · National (Protester). Hunger strike initiated; typically signals sustained activism rather than imminent violence, but warrants monitoring for escalation or civil-disobedience clustering.
- 2026-06-16 · National (Press). Associated Press investigation launched; content and targets unclear, but suggests emerging accountability or disclosure activity.
- 2026-06-16 · National (Business-Congress). Companies issued disapproval toward Congress; indicates regulatory or legislative friction without immediate operational threat.
- 2026-06-14 · Boston, Massachusetts. Police arrest or detainment reported; scale and charge category unconfirmed.
- 2026-06-14 · National (School). School-linked threat reported; specific location and nature of threat require urgent corroboration and local law-enforcement liaison.
Highest-Risk Areas
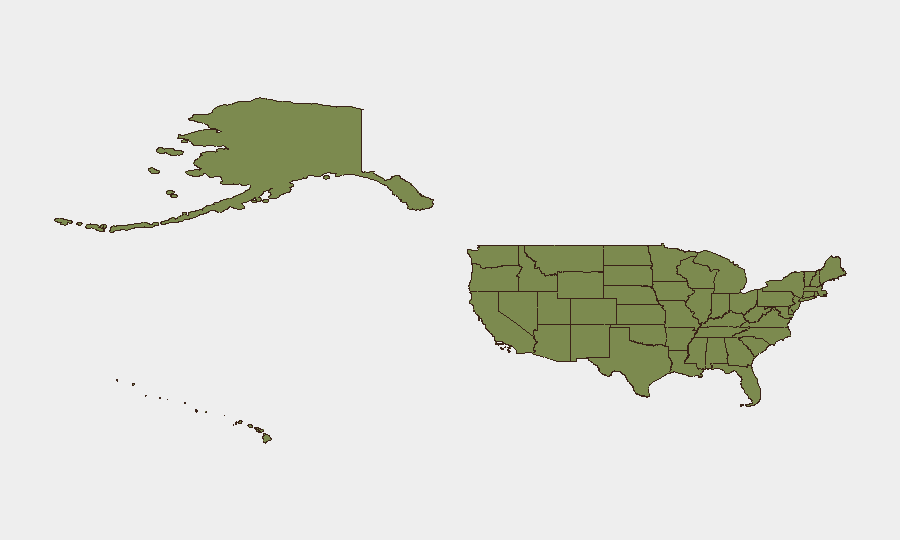
California's composite risk score (34) is the dominant driver, likely reflecting high incident density in major urban centers (Los Angeles, San Francisco Bay Area) and critical infrastructure clustering. Kansas and Texas tie at 29.4, suggesting either concentrated acute events or sustained baseline activity in specific sectors or regions within those states. New York (23.2) and Florida (19.7) round out the top five, typical of high-population states with diversified threat profiles. Risk concentration in California warrants enhanced asset and personnel monitoring; Kansas and Texas risk elevation should trigger sector-specific review (energy, agriculture, border) to confirm whether incidents reflect tactical threats or data-collection artifacts.
How GeoBit Would Assist
Intel Sweep and OSINT Fusion would corroborate the scattered 24–48-hour event signals—especially the school threat, Boston arrest, and New Jersey law-enforcement incident—against open-source media, police feeds, and social platforms to establish ground truth and scale. Area-of-Interest (AOI) Monitoring with persistent alerting on California, Kansas, and Texas would enable early detection of clustering or escalation in specific cities or sectors, automatically flagging threshold breaches for duty-of-care teams. Network & Actor Analysis would identify whether reported incidents reflect isolated incidents or organized campaigns, critical for corporate decision-making on travel, operations, and personnel safety protocols.
7-Day Outlook
No evidence suggests imminent nationwide escalation or coordinated threat activity. However, school-linked threats and protest-related activity merit continuous 48–72-hour monitoring for secondary incidents or contagion effects. Corporate security teams should maintain elevated situational awareness in California and maintain liaison with local law-enforcement in Kansas and Texas to confirm whether elevated risk scores reflect operational threats or transient event clustering.
Highest-Risk Areas — Ranked
| # | State / Region | Risk |
|---|---|---|
| 1 | California | 34 |
| 2 | Kansas | 29.4 |
| 3 | Texas | 29.4 |
| 4 | New York | 23.2 |
| 5 | Florida | 19.7 |
| 6 | Ohio | 15.4 |
| 7 | Maine | 12.3 |
| 8 | Michigan | 11.4 |
| 9 | Iowa | 11.3 |
| 10 | Virginia | 11.2 |
| 11 | Illinois | 11.1 |
| 12 | Mississippi | 10.4 |
Previous Daily Briefs
A new United States brief is written every day — each with its own risk map and downloadable CSV. Here's the last week; use the calendar to go further back.
📅 Browse every day by calendar →
Highlighted days have a brief. Tap a day for that day's map & analysis, or “csv” for that day's dataset ($5).