Situation Summary
Canada remains a low-threat environment globally (rank #159, composite score 5) but shows regional concentration of risk, particularly in Ontario and Nunavut. Recent signals indicate upticks in political dissent, police-community friction, and localized unconventional violence, chiefly in Ontario and Toronto. The overall trajectory remains stable but warrants close monitoring of Indigenous-government relations and urban civil-order dynamics.
Key Developments
GeoBit's current event feed flags the following signals within the last 48 hours, though precise incident narratives and verification remain limited by available open-source confirmation:
- Political Dissent (Inuit vs. Government), 2026-06-20 — Northern territories and Nunavut showing political friction tied to governance or resource issues; specifics require deeper OSINT corroboration.
- Unconventional Violence, Toronto, 2026-06-20 — Isolated incident in Canada's largest metropolitan area; nature and scale not yet determined from available feeds.
- Police-Community Friction, 2026-06-20 — Disapproval signals directed at police; aligns with broader North American civil-order sensitivities but lacks specific incident detail.
- Public Statements (Government and Crown Relations), 2026-06-20 — Canada-level political communication regarding monarchy or governance; low immediate security implication but may signal broader institutional messaging.
- Governance Disapproval, 2026-06-18 — Broad civil dissent signal; typical of democratic churn in Canada and not currently escalatory.
Note: Open-source confirmation of specific locations, casualty counts, and tactical details for these events is incomplete. Corporate teams with personnel or assets in Ontario and Toronto should treat these signals as precursors requiring active monitoring rather than confirmed major incidents.
Highest-Risk Areas
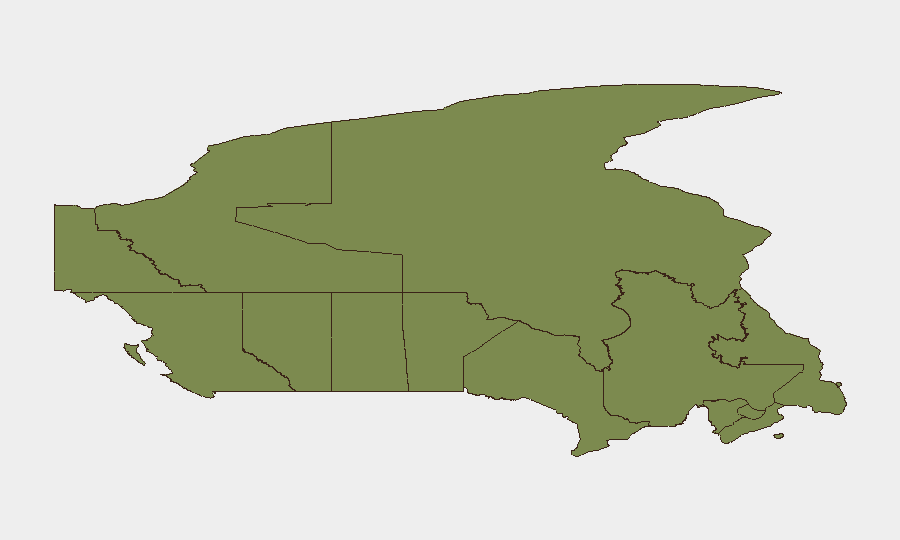
Ontario (31.5) and Nunavut (21.3) account for roughly 85% of Canada's tracked threat events. Ontario's risk is driven by Toronto's size, density, and concentration of political dissent and unconventional-violence signals; Nunavut's elevation reflects Indigenous political friction and remote-territory governance tensions. British Columbia (13.4) and Alberta (8.2) show secondary risk, likely linked to resource-sector disputes and cross-border labor unrest. Remaining provinces and territories remain below a composite score of 5, indicating baseline civil stability.
How GeoBit Would Assist
Security teams operating in Canada should employ AOI (Area-of-Interest) Monitoring & Early Warning on Ontario (especially Toronto), Nunavut, and British Columbia to receive real-time alerts on civil unrest, police actions, and political gatherings. Intel Sweep and X/Twitter OSINT would provide 24–48-hour corroboration of event signals, separating confirmed incidents from noise. Network & Actor Analysis applied to Indigenous rights groups, police unions, and labor movements would map escalation risk and key stakeholder positions, informing duty-of-care decisions for personnel in high-risk zones.
7-Day Outlook
No major escalation is forecast over the next week; signals remain fragmented and localized. However, if Indigenous-government tensions in Nunavut and the North accelerate, or if Toronto's unconventional-violence incidents cluster, risk trajectory could shift upward. Continued monitoring of police-community rhetoric and public statements by federal and provincial governments will be essential early-warning indicators.
Highest-Risk Areas — Ranked
| # | State / Region | Risk |
|---|---|---|
| 1 | Ontario | 31.5 |
| 2 | Nunavut | 21.3 |
| 3 | British Columbia | 13.4 |
| 4 | Alberta | 8.2 |
| 5 | Quebec | 6.5 |
| 6 | Manitoba | 4.6 |
| 7 | Saskatchewan | 2.6 |
| 8 | New Brunswick | 2.4 |
| 9 | Yukon | 1.7 |
| 10 | Northwest Territories | 1.7 |
| 11 | Nova Scotia | 1.7 |
| 12 | Newfoundland and Labrador | 1.5 |
Sources
Previous Daily Briefs
A new Canada brief is written every day — each with its own risk map and downloadable CSV. Here's the last week; use the calendar to go further back.
📅 Browse every day by calendar →
Highlighted days have a brief. Tap a day for that day's map & analysis, or “csv” for that day's dataset ($5).