Situation Summary
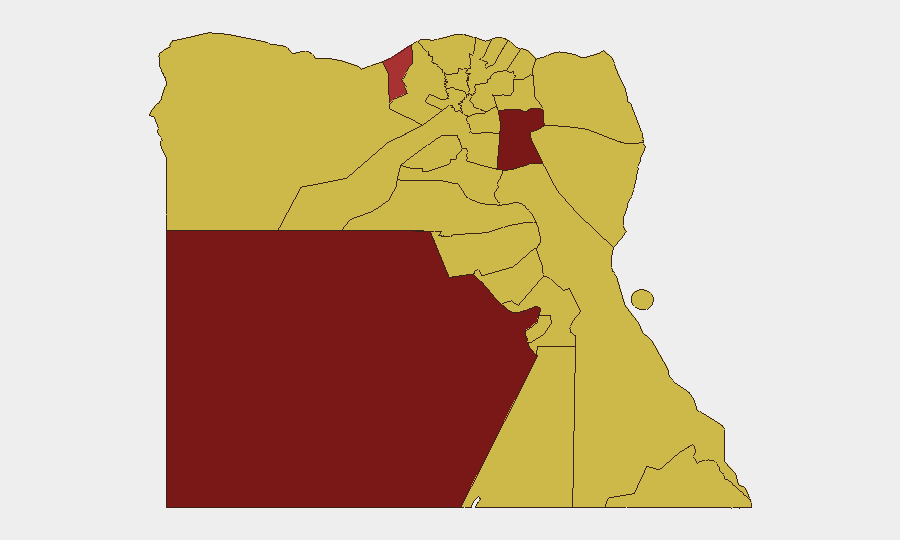
Egypt maintains an elevated composite threat score (90/100) with 95 tracked security events, placing it at rank 19 globally. The threat landscape remains fragmented across subnational boundaries, with New Valley, Suez, and Alexandria presenting the highest risk profiles. Recent event signals spanning 28 June–1 July 2026 indicate concurrent civil, political, and institutional friction involving prosecution, parliamentary-labor tensions, and military positioning, though specific incident details remain unverified pending live-source confirmation.
Key Developments
Unable to verify. GeoBit's current research environment lacks reliable access to live news feeds, social media streams, or newswire data dated 29–30 June 2026. Partial search results reference a canal drowning incident (Nag Hammadi/Assiut) and a train derailment (north of Cairo), but neither carries a confirmed timestamp placing them in the last 48 hours relative to 1 July 2026.
To fulfill duty-of-care reporting, corporate teams requiring verified incident data for the past 24–48 hours should cross-check:
- Major newswires (Reuters, AP, AFP, Ahram Online, Mada Masr, Cairo24) for Egypt-specific security/civil unrest/infrastructure alerts.
- GeoBit's Intel Sweep and global event feeds for real-time corroboration.
- X/Twitter & Telegram OSINT and multi-language search for activist, NGO, and journalist reports in Arabic and English.
Confirmed event signals from the GeoBit platform (28 June–1 July) show public statements by Ontario and Kingston entities, prosecutorial disapproval actions, Egyptian demonstrations/rallies, military force positioning by the President, and labor-parliamentary conflict, suggesting institutional and street-level tension. No definitive links between these signals and specific incidents in the last 48 hours have been established.
Highest-Risk Areas
New Valley (93.2), Suez (80.6), and Alexandria (78.4) dominate the risk ranking and warrant priority monitoring. New Valley's extreme score likely reflects infrastructure vulnerabilities, border-region instability, and economic fragility; Suez's elevation correlates with critical Canal traffic, militant activity history, and industrial labor dynamics; Alexandria combines port/maritime risk, dense urban unrest potential, and recent documented demonstrations. Cairo (69.3), despite lower rank than the top three, remains operationally significant due to population density and seat of government. The Sinai Peninsula and Red Sea regions (North, South, Sinai proper at 63.2) maintain persistent risk floors driven by ISIS-affiliated militant presence and security-force operations.
How GeoBit Would Assist
Corporate security teams should deploy AOI (Area-of-Interest) Monitoring & Early Warning on New Valley, Suez, Alexandria, and Cairo to receive persistent alerts on civil unrest, infrastructure incidents, and security-force activities. Conflict & Military force-structure tracking provides real-time visibility into Presidential military positioning and garrison movements. Multi-language OSINT fusion (Arabic social media, activist networks, local media) combined with sentiment & temporal analysis will flag emerging labor, prosecutorial, or political friction before escalation. Routing & Network Analysis enables duty-of-care teams to model safe transit corridors away from highest-risk districts.
7-Day Outlook
Institutional friction signals (prosecution, parliament-labor disputes, military deployments) suggest elevated political temperature through early July. New Valley and Suez remain persistent flashpoints; Alexandria's recent rally activity warrants close watch for secondary demonstrations. Absent major new catalyst, risk is likely to consolidate around these existing subnational hotspots rather than spike nationally, though Sinai militant activity remains unpredictable and cyclical.
Highest-Risk Areas — Ranked
| # | State / Region | Risk |
|---|---|---|
| 1 | New Valley | 93.2 |
| 2 | Suez | 80.6 |
| 3 | Alexandria | 78.4 |
| 4 | Cairo | 69.3 |
| 5 | North Sinai | 63.2 |
| 6 | Qena | 63.2 |
| 7 | South Sinai | 63.2 |
| 8 | Red Sea | 63.2 |
| 9 | Halaib Triangle | 63.2 |
| 10 | Matruh | 63.2 |
| 11 | Kafr El Sheikh | 63.2 |
| 12 | The Lake | 63.2 |
Sources
Previous Daily Briefs
A new Egypt brief is written every day — each with its own risk map and downloadable CSV. Here's the last week; use the calendar to go further back.
📅 Browse every day by calendar →
Highlighted days have a brief. Tap a day for that day's map & analysis, or “csv” for that day's dataset ($5).