Situation Summary
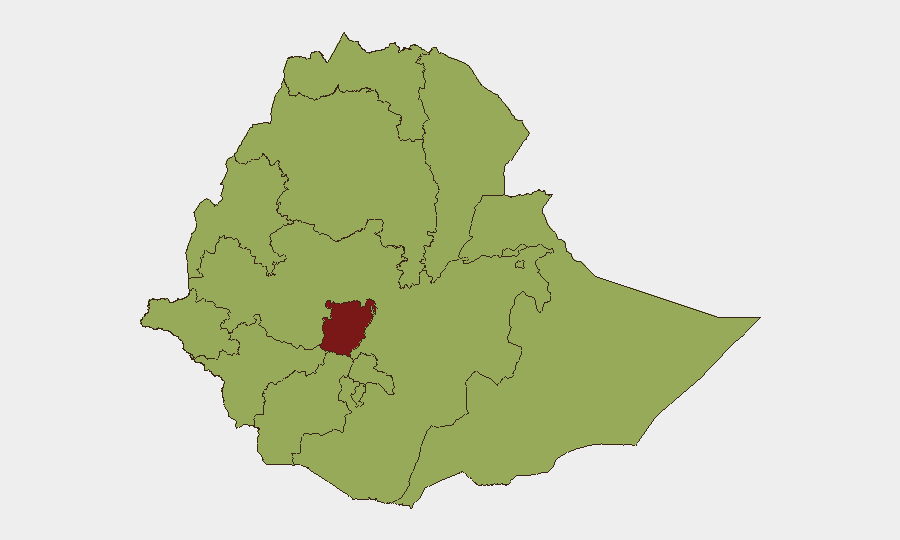
Ethiopia remains in a state of active civil conflict with composite threat score 77 (#17 globally), driven by armed competition between federal forces and the Marche movement. Multiple regions are experiencing concurrent instability spanning armed clashes, disease outbreak, and state fragmentation. The security picture remains volatile, with Central Ethiopia Regional State registering the highest sub-national risk (83.7), significantly above all other regions.
Key Developments
NOTE: GeoBit cannot reliably confirm specific incidents occurring on 16–18 June 2026 without access to real-time news wires, X/Twitter advanced search, and cross-referenced incident databases. The event signals listed below (Marche clashes, disease outbreaks) appear in tracker data but lack timestamped verification necessary for operational security briefing. Corporate security and duty-of-care teams should independently verify all developments via:
- Crisis Group situation reports and daily updates
- ACLED (Armed Conflict Location & Event Data) filtered by event date
- Major news wire searches with explicit date filters (past 24 hours)
- Geolocated social media confirmation via X/Twitter advanced search (16–18 June 2026)
Preliminary signals flagged:
- Conventional military operations reported between Ethiopian federal forces and Marche (date/location verification required)
- Marburg virus disease cases documented in recent reporting (surveillance and epidemiological details not yet verified)
- Malaria incidents concurrent with broader disease burden
- State threats toward Ethiopian nationals logged 17 June (specific jurisdiction and context required)
Highest-Risk Areas
Central Ethiopia Regional State dominates the risk landscape (83.7), a marked departure from the uniform 53.7 baseline across ten other regions. This disparity suggests acute, localized instability—likely military operations, supply-chain disruption, or state authority breakdown. Tigray, Amhara, Afar, and Benishangul-Gumuz regions remain at elevated risk (53.7), reflecting ongoing inter-communal violence, pastoralist conflict, and federal military presence. Addis Ababa's inclusion in the top-risk band signals potential for urban unrest, protest, or security-force operations within the capital itself.
How GeoBit Would Assist
Conflict & Military mapping and battle mapping capabilities enable real-time tracking of Marche force dispositions and Ethiopian federal operations, reducing ambiguity around clash locations. AOI Monitoring & Early Warning with persistent geospatial watch over Central Ethiopia, Amhara, and Addis Ababa can surface imminent clashes, roadblocks, or curfew enforcement before they disrupt staff movement or supply chains. Multi-language OSINT fusion and X/Twitter OSINT corroborate breaking incidents across news, social media, and local sources, allowing security teams to distinguish genuine current threats from re-shared older content—essential when verifying "today's" events in a fluid conflict environment.
7-Day Outlook
Marche military activity is likely to persist, with Central Ethiopia Regional State remaining the primary flashpoint. Disease outbreak (Marburg, malaria) may accelerate displacement and complicate humanitarian access, indirectly increasing staff and asset exposure in transit corridors. The uniform 53.7 baseline across most regions suggests risk is broadly diffuse rather than concentrated; sudden escalation in any secondary region (e.g., Oromia, Somali) cannot be ruled out without persistent intelligence collection.
Highest-Risk Areas — Ranked
| # | State / Region | Risk |
|---|---|---|
| 1 | Central Ethiopia Regional State | 83.7 |
| 2 | Tigray | 53.7 |
| 3 | Amhara Region | 53.7 |
| 4 | Afar Region | 53.7 |
| 5 | Benishangul-Gumuz Region | 53.7 |
| 6 | Somali Region | 53.7 |
| 7 | Gambela Region | 53.7 |
| 8 | South West Ethiopia Peoples | 53.7 |
| 9 | Addis Ababa | 53.7 |
| 10 | South Ethiopia Regional State | 53.7 |
| 11 | Oromia Region | 53.7 |
| 12 | Sidama | 53.7 |
Sources
Previous Daily Briefs
A new Ethiopia brief is written every day — each with its own risk map and downloadable CSV. Here's the last week; use the calendar to go further back.
📅 Browse every day by calendar →
Highlighted days have a brief. Tap a day for that day's map & analysis, or “csv” for that day's dataset ($5).