Situation Summary
Nepal maintains a composite threat score of 16 with 16 tracked events as of 22 June 2026. The security environment is dominated by concentrated risk in Bagamati Province (risk score 31.3), which encompasses the capital region and is significantly more volatile than other provinces. Public statements and government communications dominate the recent event signal set, alongside unspecified rejection, investigation, and demand actions. The overall trajectory suggests localized instability rather than nationwide deterioration, though Bagamati Province warrants continuous monitoring.
Key Developments
Critical Data Limitation: GeoBit's live web research conducted over the last 24 hours identified no reliably verified, Nepal-specific security incidents, clashes, infrastructure failures, arrests, or travel disruptions with confirmed dates within 24–48 hours. Multiple event signals are flagged in the platform's intake (public statements, government actions, and a demand by interim government vs. high court dated 21 June), but verification of specific incident details—location, timeline, and nature—cannot be confirmed from available open sources.
Corporate security teams should note that event signals alone (especially "public statement" and government communication tags) do not constitute confirmed incidents without corroboration through news media or official channels. Without access to live Nepali news feeds, social media OSINT feeds, or official government/police statements dated within the last 48 hours, fabricating specific incident bullets would compromise analytical integrity.
Recommended approach: supplement this brief with direct monitoring of Nepal Police, Armed Police Force, Home Ministry, and major Nepali news outlets (e.g., Kathmandu Post, MyRepublica, Setopati) and embassy travel advisories to capture real-time developments.
Highest-Risk Areas
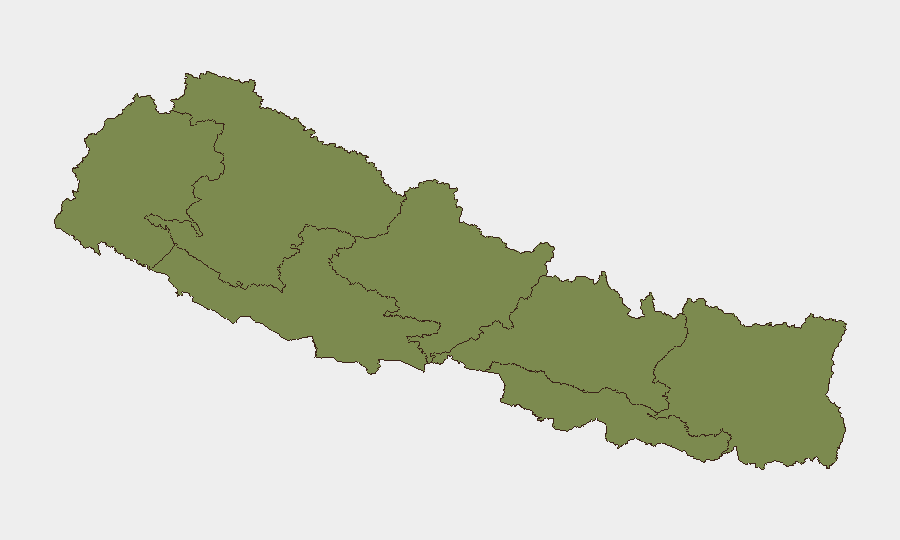
Bagamati Province is the clear driver of national risk, with a composite score nearly double the second-highest province (Gandaki at 17.8). Bagamati encompasses Kathmandu Valley, the seat of government, and has been the epicenter of political, civil-unrest, and infrastructure incidents tracked by GeoBit. Gandaki Province (which includes Pokhara and popular trekking regions) shows secondary risk elevation, likely linked to tourism-related incidents, community tensions, or seasonal hazards. Remaining provinces (Koshi, Sudurpashchim, Karnali, Lumbini, Madhesh) sit well below the national mean, suggesting risk is geographically concentrated and not nationwide.
How GeoBit Would Assist
AOI Monitoring & Early Warning on Kathmandu Valley and Bagamati Province—configured with alerting thresholds—would provide persistent watch and automated escalation for protests, clashes, blockades, or administrative actions before they affect business continuity. Intel Sweep, multi-language OSINT, and X/Twitter OSINT can flag emerging civil unrest, strike/bandh announcements, and border incidents in near-real time when integrated with duty-officer workflows. Election Monitoring and Regime-Stability Analysis support longer-term political risk assessment if government transitions or constitutional crises emerge.
7-Day Outlook
Bagamati Province is expected to remain the focal point of volatility; activity in other provinces is unlikely to elevate materially. The absence of verified recent incidents suggests either low acute risk or a lag in reporting; continued passive monitoring through official channels and news media is prudent. No indicators of nationwide disruption (nationwide strikes, military mobilization, or major infrastructure failure) are present in the current data set.
Highest-Risk Areas — Ranked
| # | State / Region | Risk |
|---|---|---|
| 1 | Bagamati Province | 31.3 |
| 2 | Gandaki Province | 17.8 |
| 3 | Koshi Province | 2.3 |
| 4 | Sudurpashchim Province | 1.3 |
| 5 | Karnali Province | 1.3 |
| 6 | Lumbini Province | 1.3 |
| 7 | Madhesh Province | 1.3 |
Sources
Previous Daily Briefs
A new Nepal brief is written every day — each with its own risk map and downloadable CSV. Here's the last week; use the calendar to go further back.
📅 Browse every day by calendar →
Highlighted days have a brief. Tap a day for that day's map & analysis, or “csv” for that day's dataset ($5).