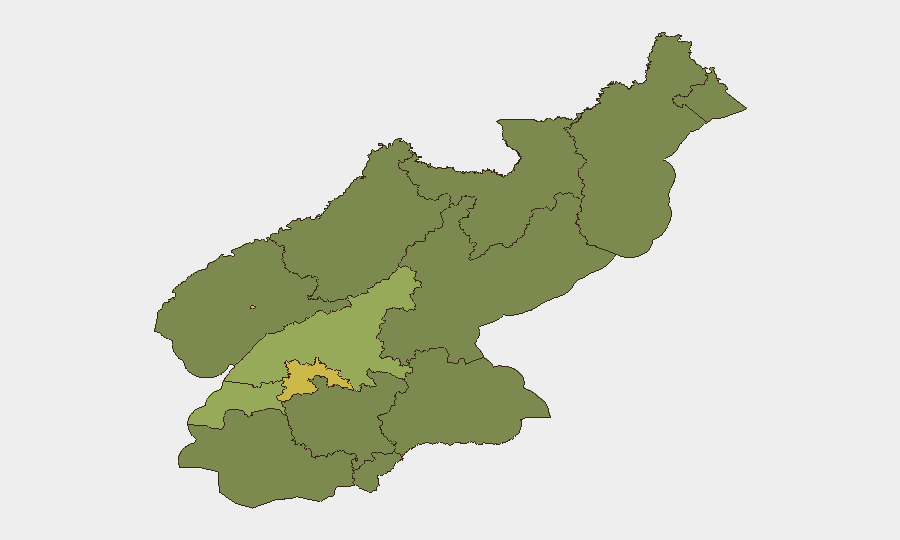
Situation Summary
North Korea remains at global threat rank #38 (composite score 57) with P'yŏngyang significantly elevated above all other regions (risk 69.9 vs. 51.1 in South Pyongan). Open-source verification for the last 24–48 hours shows no newly confirmed discrete incidents—missile tests, nuclear activity, cross-border violence, or major infrastructure events—corroborated across multiple reputable outlets. The most recent verified developments date to June 9, 2026, centered on ongoing military expansion themes rather than acute crisis events.
Key Developments
No newly verifiable discrete security incidents have been confirmed in open sources for the 24–48 hours ending June 12, 2026. Multi-outlet corroboration and specific event-type dating remain unavailable. The most recent dated assessments (June 9, 2026) from AEI, ISW, and NK News focus on:
- Missile production acceleration and naval force expansion (ongoing as of June 9; no new test or deployment confirmed in last 48h)
- North Korea–Russia military cooperation frameworks (assessed June 9; no new bilateral incident reported in last 48h)
- Nuclear fuel production continuation (assessed June 9; no new facility incident in last 48h)
Recommendation for operational teams: For current duty-of-care purposes, treat June 9 assessments as the most recent verified baseline. Discrete new incidents in the last 24–48 hours remain unconfirmed in open sources; GeoBit's Intel Sweep and OSINT fusion should be tasked to detect any breaking developments not yet surfaced in mainstream outlets.
Highest-Risk Areas
P'yŏngyang's risk score (69.9) is substantially higher than all other provinces, reflecting capital-city concentration of political control, foreign-national presence, surveillance infrastructure, and state-security apparatus activity. South Pyongan (51.1) ranks second, likely reflecting transport corridors, border proximity, and administrative density. The remaining nine provinces cluster at 39.9–40.6, indicating relatively uniform baseline risk across non-capital regions with modest variation driven by geography (border zones like Ryanggang, North Hamgyong) and economic activity (Nampo as trade hub). For organizations with staff or assets in North Korea, P'yŏngyang should receive proportionally higher monitoring intensity; South Pyongan warrants secondary focus for cross-border or transit routing.
How GeoBit Would Assist
Security teams should deploy AOI Monitoring & Early Warning on P'yŏngyang and border regions (Ryanggang, North Hamgyong) to detect police activity, checkpoint changes, or movement restrictions affecting foreign nationals. Intel Sweep and OSINT fusion (multi-language search, entity extraction, Telegram/radio SIGINT) will surface incident reports, official statements, and regime communications faster than mainstream press; conflict and regime-stability monitoring will flag destabilization signals. Routing & Network Analysis helps identify alternative travel corridors if primary routes become unsafe.
7-Day Outlook
No acute escalation is evident in the last 48 hours; baseline conditions reflect long-standing military modernization and Russia alignment rather than imminent crisis. However, the information environment remains highly restricted; discrete incidents may occur without immediate open-source confirmation. Organizations should maintain persistent monitoring and low threshold for consulting closed-source intelligence and in-country contacts if operational circumstances change.
Highest-Risk Areas — Ranked
| # | State / Region | Risk |
|---|---|---|
| 1 | P'yŏngyang | 69.9 |
| 2 | South Pyongan | 51.1 |
| 3 | Nampo | 40.6 |
| 4 | Ryanggang | 39.9 |
| 5 | North Hamgyong | 39.9 |
| 6 | North Pyongan | 39.9 |
| 7 | Chagang | 39.9 |
| 8 | South Hwanghae | 39.9 |
| 9 | North Hwanghae | 39.9 |
| 10 | South Hamgyong | 39.9 |
| 11 | Kaesong | 39.9 |
| 12 | Kangwon | 39.9 |
Sources
Previous Daily Briefs
A new North Korea brief is written every day — each with its own risk map and downloadable CSV. Here's the last week; use the calendar to go further back.
📅 Browse every day by calendar →
Highlighted days have a brief. Tap a day for that day's map & analysis, or “csv” for that day's dataset ($5).