Situation Summary
South Africa ranks #64 globally in composite threat exposure (score 19; 2,866 tracked events) with a mixed but concerning security profile. Physical security incidents remain limited in the last 24–48 hours, but cyber-breach activity has surged sharply—3,219 reported data breaches in FY2025/26 inflicted estimated losses of R141.96–142 billion (1.81% of GDP)—and online communal hostility targeting Muslims has intensified since 6–7 July. Critical infrastructure remains under pressure from ransomware, fiber-cable theft, and tower vandalism; regulatory travel requirements have tightened as of 1 July 2026. The threat environment is primarily cyber and online-social rather than acute physical unrest at present.
Key Developments
- National (South Africa) – 1 July 2026 (announced 7 July 2026)
U.S. Embassy in Pretoria mandated online customs declaration for all travelers entering/exiting South Africa up to 24 hours before departure, with limited paper exceptions. Level 2 advisory remains in effect citing crime, terrorism, unrest, and civil disturbance.
- National (South Africa) – FY2025/26 financial year (reported 7 July 2026)
Cube ICT Solutions and Business Report published data showing 3,219 reported data breaches in South Africa during 2025/26, with aggregate economic impact of R141.96–142 billion and upward trajectory since April 2025.
- National (South Africa) – 6–7 July 2026
Georgetown Bridge Initiative documented a new wave of online anti-Muslim hate speech and hostility on social platforms in South Africa, signaling rising communal tension with potential implications for community safety and social cohesion.
- National (South Africa) – ongoing, early July 2026 reporting
Commentary on digital-infrastructure security noted recurring ransomware attacks, fiber-cable theft, and tower vandalism targeting telecom networks, described as current and persistent threats to critical communications.
- Event Signals (5–7 July 2026)
GeoBit's event database registered multiple governance and media-related statements, appeals-court disapprovals, employer-related actions, and a violent protest involving Nigerian actors on 7 July, indicating elevated political and social friction.
Highest-Risk Areas
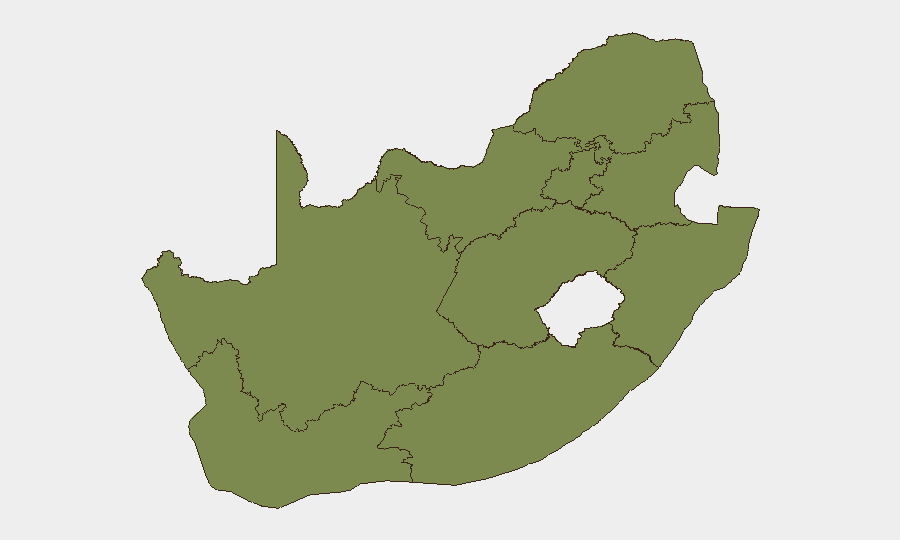
North West Province dominates the sub-national risk ranking (32.5), driven by historical patterns of labor unrest, land disputes, and informal-settlement volatility. Eastern Cape (18.1) and Free State (16.7) follow, reflecting ongoing service-delivery tensions and criminal activity. Gauteng (15.8), home to Johannesburg and Pretoria, carries material risk from dense urban crime, cyber exposure, and governance friction. KwaZulu-Natal, Western Cape, Northern Cape, and Mpumalanga present significantly lower composite scores (2.5–7.2), indicating more stable conditions; however, concentrated cyber-breach exposure is national rather than regional.
How GeoBit Would Assist
Corporate security and duty-of-care teams should deploy AOI Monitoring & Early Warning on North West, Eastern Cape, and Gauteng to detect emerging unrest, labor action, or service-delivery escalation before it affects operations or travel. Intel Sweep and OSINT fusion across X/Twitter, Telegram, and local news feeds enable real-time detection of cyber-threat campaigns, anti-Muslim sentiment escalation, and political friction that could spill into physical violence. Risk & Threat Assessment and Network & Actor Analysis provide strategic intelligence on labor organizers, protest movements, and cyber-threat actors to inform workforce security and infrastructure-protection posture.
7-Day Outlook
Cyber-security incidents are expected to persist at elevated levels given the FY2025/26 breach trajectory and ongoing critical-infrastructure attacks. Online communal hostility may fluctuate but is unlikely to trigger major immediate physical unrest; however, sustained anti-Muslim sentiment carries potential for localized community friction. Political and governance tensions reflected in recent statements and court actions warrant continued monitoring for downstream labor action or service-delivery protest, particularly in North West and Eastern Cape.
Highest-Risk Areas — Ranked
| # | State / Region | Risk |
|---|---|---|
| 1 | North West | 32.5 |
| 2 | Eastern Cape | 18.1 |
| 3 | Free State | 16.7 |
| 4 | Gauteng | 15.8 |
| 5 | Limpopo | 12.3 |
| 6 | KwaZulu-Natal | 7.2 |
| 7 | Northern Cape | 2.5 |
| 8 | Western Cape | 2.5 |
| 9 | Mpumalanga | 2.5 |
Sources
Previous Daily Briefs
A new South Africa brief is written every day — each with its own risk map and downloadable CSV. Here's the last week; use the calendar to go further back.
📅 Browse every day by calendar →
Highlighted days have a brief. Tap a day for that day's map & analysis, or “csv” for that day's dataset ($5).
Atlas — our AI intelligence desk — emails them this snapshot personally. Nothing else, no list.