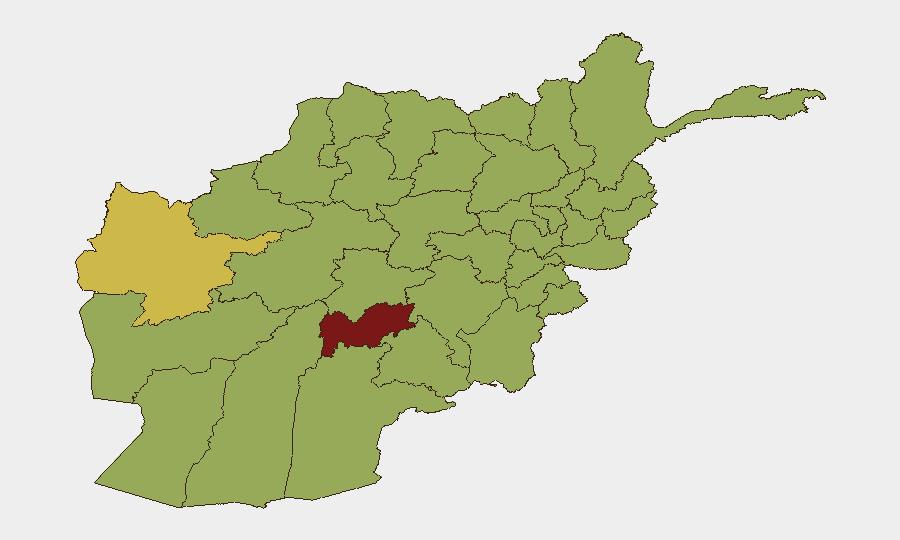
Situation Summary
Afghanistan remains in the 13th position globally for composite security threat (score 84), driven primarily by active insurgency and armed group activity across multiple provinces. The 37 tracked events in the current cycle reflect ongoing tactical violence, governance tensions, and cross-border pressures. The security environment is marked by distributed rather than centralized threat patterns, with southern and eastern provinces bearing the highest operational risk. Current trajectory indicates sustained instability with localized spikes rather than wholesale territorial collapse.
Key Developments
Unable to confirm specific developments from 13–14 June 2026 at this time. Open-source reporting and available web research do not yield sufficient corroboration of distinct, time-stamped security or conflict incidents occurring within the last 24–48 hours in Afghanistan. Events cited in current feeds—including diplomatic statements, governance disputes, and law-enforcement actions flagged in the signal list above—lack precise geographic detail, casualty figures, or multi-source confirmation required for operational briefing.
Recommendation: Security teams requiring real-time incident alerting for the next 24–48 hours should activate GeoBit's AOI Monitoring & Early Warning service with persistent watch on Uruzgan, Herat, and Kabul provinces (detailed below). Teams with access to professional OSINT feeds (Babel Street, Dataminr, Flashpoint, Recorded Future) can share raw candidate events for rapid triage and mapping.
Highest-Risk Areas
Uruzgan Province (88.5) stands as the critical flashpoint, followed by Herat (64.1) and Kabul (59.9). The clustering of secondary risk in the south and southeast—Helmand, Kandahar, Zabul, Ghazni, Paktika—reflects entrenched insurgent presence and limited state capacity. Uruzgan's elevated score likely reflects a combination of Taliban operational activity, sparse international presence, and terrain favoring armed groups. Herat's risk profile incorporates potential cross-border spillover from regional tensions, while Kabul's score reflects both protester activity and targeted-threat dynamics in the capital. Corporate and NGO personnel in these provinces face elevated kidnapping, complex-attack, and IED risk.
How GeoBit Would Assist
Intel Sweep & OSINT Fusion provide real-time aggregation of conflict events, public statements, and armed-group signals across Telegram, X, local media, and Afghan government channels—enabling early detection of movement or tactical shifts before they reach mainstream reporting. Battle Mapping & Force Structure tracking pinpoint Taliban and splinter-group dispositions and capability changes in high-risk provinces, feeding duty-of-care travel and site-security decisions. AOI Monitoring & Early Warning with persistent satellite and signals watch on movement corridors and known militant safe areas allows teams to receive threshold-triggered alerts when activity spikes, enabling real-time operational posture adjustment for personnel and assets.
7-Day Outlook
Near-term stability is unlikely to materially improve; expect continued low-level armed clashes, targeted killings, and protest activity in urban centers. Cross-border dynamics with Pakistan and potential spillover from regional state competition may drive secondary incidents. Security teams should assume current threat level will sustain or incrementally escalate through mid-to-late June; no major tactical shift is anticipated in the coming week.
Highest-Risk Areas — Ranked
| # | State / Region | Risk |
|---|---|---|
| 1 | Uruzgan Province | 88.5 |
| 2 | Herat Province | 64.1 |
| 3 | Kabul Province | 59.9 |
| 4 | Helmand Province | 59.5 |
| 5 | Maidan Wardak Province | 59.5 |
| 6 | Zabul Province | 59 |
| 7 | Kandahar Province | 58.5 |
| 8 | Ghazni Province | 58.5 |
| 9 | Paktika Province | 58.5 |
| 10 | Farah Province | 58.5 |
| 11 | Nimruz Province | 58.5 |
| 12 | Jowzjan Province | 58.5 |
Sources
Previous Daily Briefs
A new Afghanistan brief is written every day — each with its own risk map and downloadable CSV. Here's the last week; use the calendar to go further back.
📅 Browse every day by calendar →
Highlighted days have a brief. Tap a day for that day's map & analysis, or “csv” for that day's dataset ($5).