Situation Summary
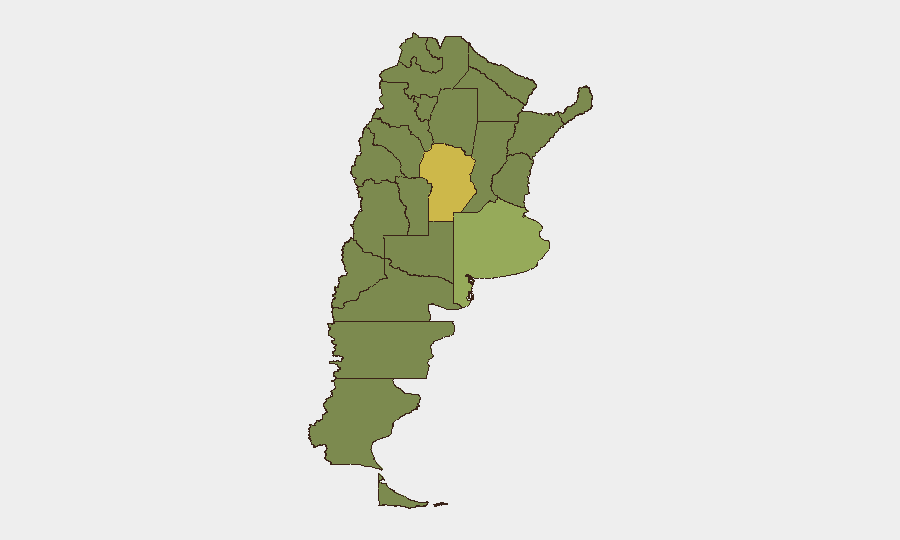
Argentina maintains a composite threat ranking of #41 globally, with a score of 50 across 323 tracked events. No confirmed new security incidents occurred in the 24–48 hours ending 28 June 2026, though authorities sustained a heightened visible security posture in major urban centers as a precautionary measure tied to regional geopolitical developments rather than domestic escalation. Political and administrative tensions persist in high-risk provinces, particularly Córdoba and Buenos Aires, but current threat trajectory remains stable with no verified violent incidents or infrastructure disruptions reported in the immediate period.
Key Developments
- Argentina, nationwide — 26 June 2026: Open-source monitoring detected no confirmed new security incidents, major protests, or infrastructure disruptions during the prior 24–48-hour window.
- Buenos Aires and major urban centers — 24–26 June 2026: Heightened visible police and military presence observed as a precautionary posture; no incident-specific deployment noted, but presence maintained due to regional geopolitical considerations.
- Córdoba and Buenos Aires provinces — 24–26 June 2026: Monitoring flagged these zones as elevated-risk due to ongoing political and administrative tensions; no new violent escalation confirmed in the 48-hour period.
- Recent event signal activity — 26 June 2026: Multiple public statements and government rejections recorded across sectors (government, business, education, healthcare), suggesting heightened civic communication and political discourse but no acute security incidents associated.
Highest-Risk Areas
Córdoba Province (risk 64.9) ranks significantly above other regions and is the primary driver of Argentina's national threat profile, reflecting persistent political and administrative friction. Buenos Aires Province (49.5) and the Autonomous City of Buenos Aires (38.9) follow, creating a concentration of risk in the country's economic and political core. A secondary cluster of elevated risk spans the northwest and northeast provinces (Jujuy, Salta, Misiones, Chaco, and Santiago del Estero in the 35–38 range), historically associated with cross-border smuggling networks, informal economy activity, and resource-competition tensions. The gap between Córdoba and the second-ranked province is notable and warrants targeted monitoring of provincial governance and labor-related friction.
How GeoBit Would Assist
Security teams should deploy Intel Sweep and multi-language OSINT fusion to monitor Córdoba and Buenos Aires Province continuously for signs of political escalation, labor action, or protest activity that could affect personnel or facilities. AOI Monitoring & Early Warning with persistent watch on high-risk zones and alert triggering would provide real-time notification of incidents affecting specific corporate locations or routes. Network & Actor Analysis combined with sentiment analysis on social media and local news feeds would flag emerging tensions before they manifest as public events, enabling proactive duty-of-care responses.
7-Day Outlook
No acute security deterioration is forecast for the next 7 days based on current intelligence. Continued heightened police/military visibility in urban centers should be expected as a precautionary norm rather than a sign of imminent escalation. Personnel and asset teams should maintain standard security protocols while monitoring local administrative developments in Córdoba and Buenos Aires provinces; escalation risk remains moderate but non-urgent.
Highest-Risk Areas — Ranked
| # | State / Region | Risk |
|---|---|---|
| 1 | Córdoba | 64.9 |
| 2 | Buenos Aires Province | 49.5 |
| 3 | Autonomous City of Buenos Aires | 38.9 |
| 4 | Río Negro Province | 38.3 |
| 5 | La Rioja Province | 38.1 |
| 6 | Santiago del Estero Province | 37.4 |
| 7 | Jujuy Province | 35.9 |
| 8 | Salta Province | 35.4 |
| 9 | Misiones | 35.1 |
| 10 | Santa Fe Province | 35.1 |
| 11 | Chaco Province | 35.1 |
| 12 | San Juan Province | 34.9 |
Sources
Previous Daily Briefs
A new Argentina brief is written every day — each with its own risk map and downloadable CSV. Here's the last week; use the calendar to go further back.
📅 Browse every day by calendar →
Highlighted days have a brief. Tap a day for that day's map & analysis, or “csv” for that day's dataset ($5).