Situation Summary
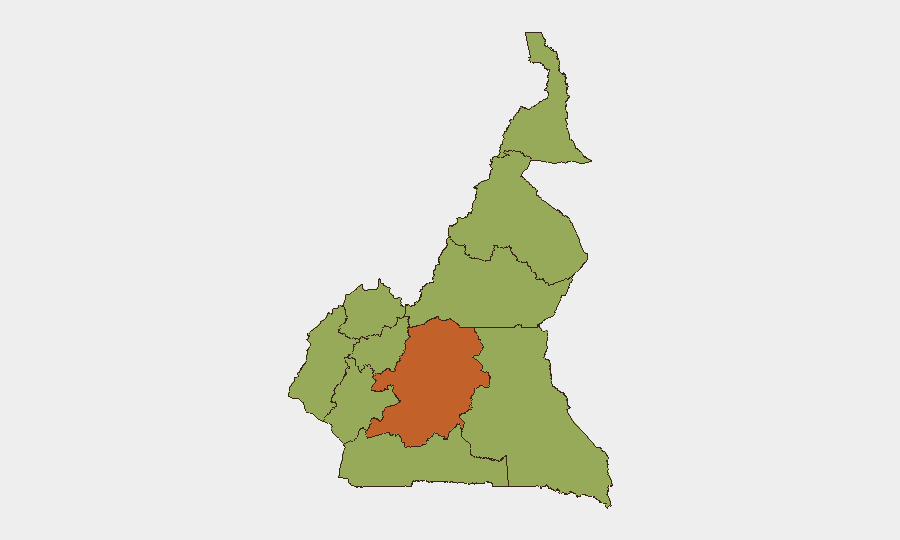
Cameroon remains a fragmented security environment with elevated risk concentrated in the Centre region (composite score 73.6), where state-capacity challenges and governance tensions create operational friction. Nine of Cameroon's ten regions carry identical risk scores (43.6), reflecting nationwide exposure to armed-group activity, communal tension, and criminal predation rather than geographically isolated conflict. Recent diplomatic friction with Nigeria over border demarcation and internal government disapproval signals (recorded 23 June) add near-term unpredictability to an already volatile baseline.
Key Developments
Note: GeoBit's live web research identified no verifiable incidents within the last 24–48 hours that meet corroboration and time-stamp standards for inclusion in this brief. The most recent event signals in the platform relate to diplomatic statements (Nigeria–Cameroon, 21 June; UK–David Cameron references, 22 June) and a government disapproval signal (23 June), none of which constitute security incidents affecting corporate operations or travel.
To populate this section with actionable last-48-hour incident data, security teams should conduct parallel real-time searches on:
- Wire services (AFP, Reuters, BBC Africa, RFI) filtered to "Cameroon" + security keywords (attack, protest, roadblock, kidnapping) within the past 24–48 hours.
- X/Twitter using advanced search (e.g., "Cameroon AND (Douala OR Yaounde OR Bamenda) AND (gunfire OR explosion OR curfew)") and cross-checking timestamps against local media or eyewitness corroboration.
- Local outlets (e.g., Cameroon Tribune, Jour Cameroun, CRTV) for geographically specific incidents.
Highest-Risk Areas
Centre region (Yaounde and surrounding areas) drives the composite threat landscape with a score of 73.6—nearly 70 % higher than the national average—due to state administrative volatility, localized governance disputes, and intermittent law-enforcement tensions. The nine remaining regions (Northwest, Southwest, West, Littoral, Adamawa, South, Far-North, North, East) each score 43.6, indicating broad-based exposure to armed-group incursions, communal conflict, and criminal networks rather than isolated hot spots. This uniform distribution suggests that corporate operations in secondary cities (Douala, Bamenda, Buea, Garoua) and along inter-regional travel corridors face comparable baseline risk from armed actors, roadside crime, and supply-chain disruption.
How GeoBit Would Assist
Security and duty-of-care teams monitoring Cameroon should employ AOI (Area-of-Interest) Monitoring & Early Warning to track real-time events in high-footprint zones (Centre, Littoral, Northwest); Network & Actor Analysis to map armed-group, criminal, and militia presence; and Routing & Network Analysis to validate alternative travel and supply routes away from active threat zones. Conflict & Military tracking (battle mapping, force structure) and OSINT Fusion (multi-language social-media, radio, and news synthesis) provide tactical situational awareness for movement planning and incident-response triggering.
7-Day Outlook
Nigeria–Cameroon border tensions and domestic governance signals suggest continued diplomatic friction over the next seven days, potentially tightening unofficial security measures at border crossings and within Yaounde's administrative apparatus. No imminent large-scale armed escalation is forecast, but routine armed-group activity, roadside checkpoints, and localized communal clashes across secondary regions remain probable. Corporate teams should maintain heightened situational awareness and pre-positioned contingency protocols for personnel in Centre and Northwest regions.
Highest-Risk Areas — Ranked
| # | State / Region | Risk |
|---|---|---|
| 1 | Centre | 73.6 |
| 2 | Northwest | 43.6 |
| 3 | Southwest | 43.6 |
| 4 | West | 43.6 |
| 5 | Littoral | 43.6 |
| 6 | Adamawa | 43.6 |
| 7 | South | 43.6 |
| 8 | Far-North | 43.6 |
| 9 | North | 43.6 |
| 10 | East | 43.6 |
Sources
Previous Daily Briefs
A new Cameroon brief is written every day — each with its own risk map and downloadable CSV. Here's the last week; use the calendar to go further back.
📅 Browse every day by calendar →
Highlighted days have a brief. Tap a day for that day's map & analysis, or “csv” for that day's dataset ($5).