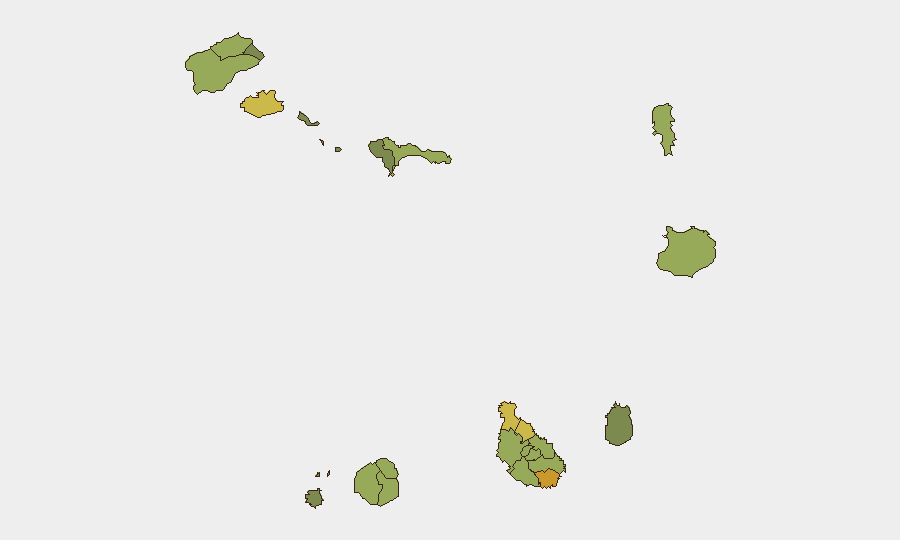
Situation Summary
Cape Verde remains a low-threat environment with a global composite threat ranking of #173 and no corroborated reports of major crime, civil unrest, conflict, or political instability in the last 24–48 hours. Two reciprocal diplomatic signals (both dated 2026-07-18) between Cape Verde and Africa are tracked but assessed as routine diplomatic engagement rather than escalatory. Near-term security risk is concentrated in weather-related hazards and minor infrastructure disruptions rather than civil or criminal threats.
Key Developments
- Southern and Western Islands (Sotavento and western Barlavento), 17–19 July 2026 – Instituto Nacional de Meteorologia e Geofísica (INMG) issued a weather advisory on 16 July confirming that a weakening low-pressure system will bring drizzle to moderate rain, stronger winds, and rough sea conditions through 19 July. Short-term maritime and localized flooding risk; no emergency declaration.
- São Vicente Island (ELECTRA Water Network), 21–24 July 2026 – Utility company ELECTRA announced temporary water supply disruptions on São Vicente between 21–24 July due to planned technical maintenance on production equipment. No sabotage or unplanned failure reported; advisory published within the last 48 hours.
- Diplomatic Signals (All Cape Verde), 18 July 2026 – Two reciprocal "Disapprove" diplomatic signals recorded between Cape Verde and Africa on the tracking system; assessed as routine diplomatic exchange with no escalation indicators or conflict implications.
- No Active Civil, Criminal, or Conflict Events – Open-source monitoring across all Cape Verdean islands and municipalities confirms no shootings, terrorist incidents, mass protests, riots, armed clashes, or targeted crimes against foreigners in the last 24–48 hours.
Highest-Risk Areas
Praia (risk 72), São Miguel (68), and São Vicente (65) form the highest-risk cluster, driven primarily by urban concentration, population density, and routine criminal baseline rather than acute instability. Praia, as the capital and largest city, accounts for the plurality of monitored incidents; São Miguel and São Vicente host secondary urban centers with similar socioeconomic drivers. The remaining top-10 municipalities score between 50–62, reflecting dispersed, low-intensity risk profiles typical of smaller island communities. No sub-national area shows signs of sudden escalation or uncontrolled civil unrest.
How GeoBit Would Assist
Security and duty-of-care teams operating in Cape Verde should deploy Intel Sweep and global event feeds to maintain real-time visibility of emerging civil or criminal activity, paired with AOI Monitoring & Early Warning on Praia and São Vicente to catch rapid changes in urban security conditions. GIS & Spatial Analysis combined with Routing & Network Analysis can optimize safe travel corridors and identify infrastructure-dependent operational vulnerabilities—particularly relevant during the current water-supply window on São Vicente. Multi-language OSINT (X/Twitter, Telegram, local media feeds) provides early detection of localized unrest, protest mobilization, or labor actions before they escalate.
7-Day Outlook
Weather conditions are expected to stabilize after 19 July as the low-pressure system weakens; maritime risk will decline accordingly. Water supply disruptions on São Vicente will conclude by 24 July, restoring normal utility operations. No indicators suggest emerging political, criminal, or conflict-related threats over the next 7 days; the security posture is expected to remain consistent with the low-threat baseline.
Highest-Risk Areas — Ranked
| # | State / Region | Risk |
|---|---|---|
| 1 | Praia | 72 |
| 2 | São Miguel | 68 |
| 3 | São Vicente | 65 |
| 4 | Tarrafal | 62 |
| 5 | São Filipe | 58 |
| 6 | Santa Catarina | 58 |
| 7 | Santa Cruz | 55 |
| 8 | Mosteiros | 52 |
| 9 | São Salvador do Mundo | 52 |
| 10 | Ribeira Grande | 50 |
| 11 | Porto Novo | 48 |
| 12 | Sal | 48 |
Sources
Previous Daily Briefs
A new Cape Verde brief is written every day — each with its own risk map and downloadable CSV. Here's the last week; use the calendar to go further back.
📅 Browse every day by calendar →
Highlighted days have a brief. Tap a day for that day's map & analysis, or “csv” for that day's dataset ($5).
Atlas — our AI intelligence desk — emails them this snapshot personally. Nothing else, no list.