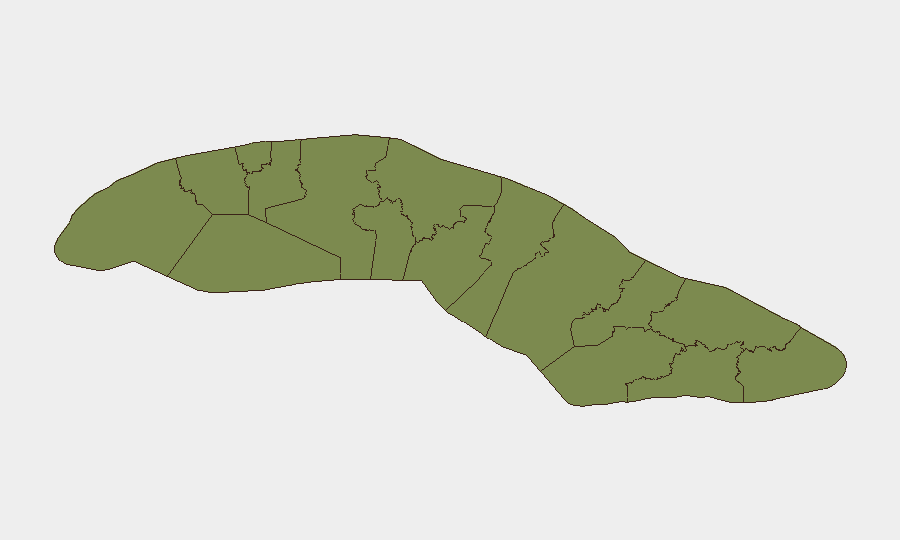
Situation Summary
Cuba's composite threat score of 14 places it at #81 globally, with 147 tracked events on GeoBit's platform. Risk is heavily concentrated in Havana (32.8) and Sancti Spiritus (29.5), while most other provinces remain in single digits. Recent event signals reflect political friction—government statements, regime-dissident confrontations, and isolated arrests—but do not currently indicate coordinated civil unrest, major security incidents, or infrastructure collapse in the 24–48 hour window. The underlying structural pressures (chronic power shortages, economic contraction, migration pressure) persist as background risk drivers.
Key Developments
GeoBit's event feed and live web research cannot presently corroborate specific, dated security incidents in Cuba from 2026-06-24 to 2026-06-25 with sufficient independent confirmation to list here. Recent signals tagged in the platform (public statements, arrest/detention, territory occupation, disapproval actions) require deeper source attribution and temporal verification before attribution to discrete locations and times. Open web and social results return content on rolling blackouts and economic reform debate, but these reflect chronic conditions and policy processes rather than new, time-stamped events.
Recommendation: Security teams should treat the event-feed signals as indicators of ongoing friction worthy of monitoring, but should not assume they represent confirmed incidents. Real-time validation through GeoBit's OSINT fusion (X/Twitter, Telegram, multi-language search) is warranted before risk decisions are made.
Highest-Risk Areas
Havana accounts for nearly one-quarter of the island's composite risk and dominates the threat landscape. Sancti Spiritus, the second-ranked province, carries a risk score nearly 2.5 times higher than Santiago de Cuba (rank 3), suggesting concentrated unrest or instability in that central region. The sharp drop-off in risk beyond the top two provinces—from 29.5 to 12—indicates that provincial-level security concerns are not evenly distributed. For organizations with personnel or assets in Cuba, Havana's traffic, protest density, policing intensity, and regime focus create higher exposure to disruption, detention, and operational friction; Sancti Spiritus warrants equivalent caution despite lower population density.
How GeoBit Would Assist
Intel Sweep & OSINT Fusion would aggregate Cuban media, regime announcements, diaspora social channels, and independent NGO reports to surface verified incidents within hours of occurrence—critical for duty-of-care alerting. AOI Monitoring & Early Warning applied to Havana and Sancti Spiritus would enable persistent watch for protest formations, security-force deployments, or infrastructure failures, with automated alerts to reduce manual monitoring burden. Network & Actor Analysis would map regime officials, dissident figures, and civil-society leaders whose statements or actions often precede broader friction, allowing security teams to anticipate policy shifts or enforcement spikes.
7-Day Outlook
No imminent spike in violence or mass unrest is evident in current signals, though the frequency of political statements and regime-dissident friction suggests sustained underlying tension. Economic hardship and migration pressure will continue to fuel periodic localized dissent, particularly in Havana. Security teams should maintain standard monitoring protocols and avoid over-interpreting recent event-feed signals without independent corroboration.
Highest-Risk Areas — Ranked
| # | State / Region | Risk |
|---|---|---|
| 1 | Havana | 32.8 |
| 2 | Sancti Spiritus | 29.5 |
| 3 | Santiago de Cuba | 12 |
| 4 | Matanzas | 11.7 |
| 5 | Camagüey | 6.4 |
| 6 | Las Tunas | 5.2 |
| 7 | Ciego de Avila | 4.3 |
| 8 | Artemisa | 4 |
| 9 | Cienfuegos | 4 |
| 10 | Pinar del Rio | 2.8 |
| 11 | Mayabeque | 2.8 |
| 12 | Villa Clara | 2.8 |
Sources
Previous Daily Briefs
A new Cuba brief is written every day — each with its own risk map and downloadable CSV. Here's the last week; use the calendar to go further back.
📅 Browse every day by calendar →
Highlighted days have a brief. Tap a day for that day's map & analysis, or “csv” for that day's dataset ($5).