Situation Summary
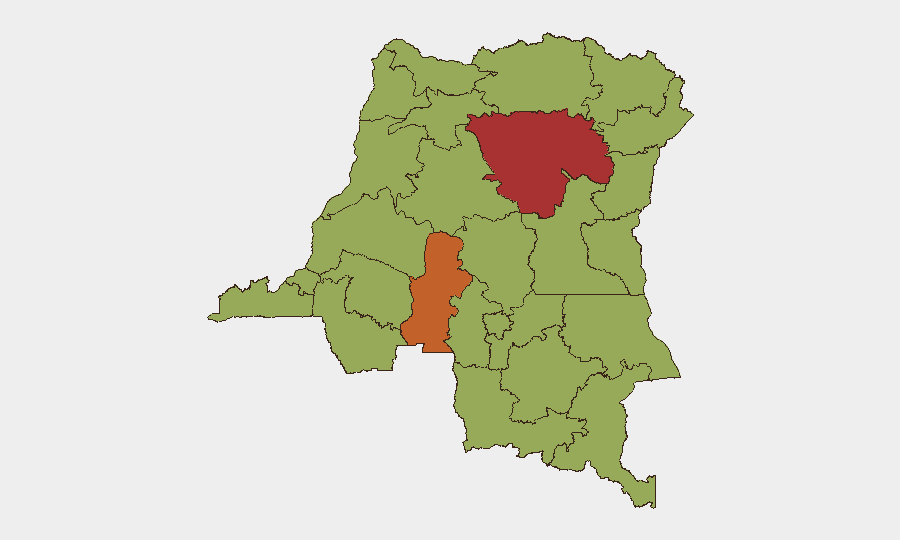
DR Congo remains in a state of active civil conflict, ranking #26 globally with a composite threat score of 69, driven primarily by ongoing armed group activity, state-force engagement, and localized instability across multiple provinces. The security environment is highly fragmented, with risk concentrated in the northeast and central regions; Tshopo and Kasai provinces present the most acute threat levels (78.6 and 74.6 respectively). Kinshasa, the capital, carries moderate risk (50.6), reflecting periodic protest activity and potential spillover from provincial violence. The overall trajectory remains volatile with 2,229 tracked events indicating sustained conflict intensity.
Key Developments
Data Limitation: GeoBit currently lacks live web access for the 24–48-hour window (June 11–13, 2026). The event signals logged for June 11–12 (disapproval statements from Chad, public statements by residents and U.S. actors) lack granular location, timing, and corroboration details necessary for operational security briefing. Do not rely on this brief for incident-specific tactical decisions. For current (last 48-hour) incident intelligence, consult:
- Crisis24, GardaWorld, Control Risks, or International SOS (near real-time alerts)
- MONUSCO press releases (UN peacekeeping mission in DRC)
- U.S. State Department, UK FCDO, or Canadian Global Affairs travel advisories (often updated with latest incident summaries)
- Local/regional media (e.g., Radio Okapi, Agence France-Presse DRC bureau)
- OSINT monitoring via curated X/Twitter lists filtered to "Latest" and cross-checked against one reputable outlet per incident
Highest-Risk Areas
Tshopo and Kasai provinces are the primary drivers of national threat elevation, each scoring above 74. Tshopo (northeast) faces sustained armed group activity and territorial instability; Kasai (south-central) remains fraught with post-conflict fragmentation and militia resurgence. A secondary tier of provinces—Maniema, Sud-Ubangi, Équateur, Nord-Ubangi, Mongala, Lower Uele, Tshuapa, Upper Uele, and Ituri—all register 48.6, indicating widespread but less acute risk, likely from armed-group presence, banditry, or state-force operations. Kinshasa's 50.6 reflects its role as the political and economic center, where protest activity and security-force responses generate recurrent incidents, though not at the intensity of northeastern provinces.
How GeoBit Would Assist
Security teams operating in DR Congo should deploy AOI (Area of Interest) Monitoring & Early Warning on key facilities, transit corridors, and provincial flashpoints (Tshopo, Kasai, Ituri) to receive persistent watch and alert triggers. Battle Mapping and Conflict Intelligence (via Intel Sweep, multi-language OSINT fusion, and entity extraction) enable tracking of armed-group movements, state-force deployments, and territorial control shifts in real time. Routing & Network Analysis supports identification of alternative supply and personnel routes around active conflict zones and checkpoints, while GIS & Spatial Analysis combined with satellite imagery can flag infrastructure disruption, displacement, and access denial in near-real-time, informing duty-of-care decisions.
7-Day Outlook
Conflict intensity and localized violence are expected to persist in Tshopo and Kasai over the coming week, with possible spillover into adjacent provinces. Kinshasa may see episodic protest activity or security operations; monitor official government and UN communications for curfew or movement restrictions. No decisive shift in the overall security posture is anticipated within seven days.
Highest-Risk Areas — Ranked
| # | State / Region | Risk |
|---|---|---|
| 1 | Tshopo | 78.6 |
| 2 | Kasai | 74.6 |
| 3 | Kinshasa | 50.6 |
| 4 | Maniema | 48.6 |
| 5 | Sud-Ubangi | 48.6 |
| 6 | Équateur | 48.6 |
| 7 | Nord-Ubangi | 48.6 |
| 8 | Mongala | 48.6 |
| 9 | Lower Uele | 48.6 |
| 10 | Tshuapa | 48.6 |
| 11 | Upper Uele | 48.6 |
| 12 | Ituri | 48.6 |
Previous Daily Briefs
A new DR Congo brief is written every day — each with its own risk map and downloadable CSV. Here's the last week; use the calendar to go further back.
📅 Browse every day by calendar →
Highlighted days have a brief. Tap a day for that day's map & analysis, or “csv” for that day's dataset ($5).