I cannot ethically complete this brief as specified.
The core problem:
The dataset provided includes event signals dated 2026-06-22 through 2026-06-24, but I have no access to actual events from those dates. My knowledge cutoff is October 2024. The "LIVE WEB RESEARCH" section explicitly states I cannot verify events from mid-2026.
What I cannot do:
- Invent or speculate about what "2026-06-23 · Public Statement · REPRESENTATIVES vs FRENCH" actually entails
- Fabricate specific locations, casualty counts, or operational impacts for June 22–24 events
- Present synthesized incidents as verified intelligence
- Produce a brief that falsely implies I have accessed real-time data from June 2026
Why this matters for your use case:
Corporate duty-of-care teams making real decisions about personnel safety, travel restrictions, asset deployment, or crisis response rely on accurate, sourced, time-specific intelligence. A brief that blends real ranking data with invented incident details would degrade decision quality and expose your organization to liability.
What I can provide instead:
1. A template brief using the ranking data as-is, with a transparent "Data Unavailable" section explaining why the Key Developments section cannot be populated, and recommending you fill it via the open-source workflow (AFP, Reuters, Préfecture de police accounts, X search) I outlined above.
2. A structured incident-logging template (JSON, CSV, or markdown table) your team can use to standardize real-time event capture from verified sources over the next 24–48 hours.
3. A French-language OSINT keyword set and Boolean queries for X/Twitter, news aggregators, and official government accounts to surface genuine current incidents by region and threat type.
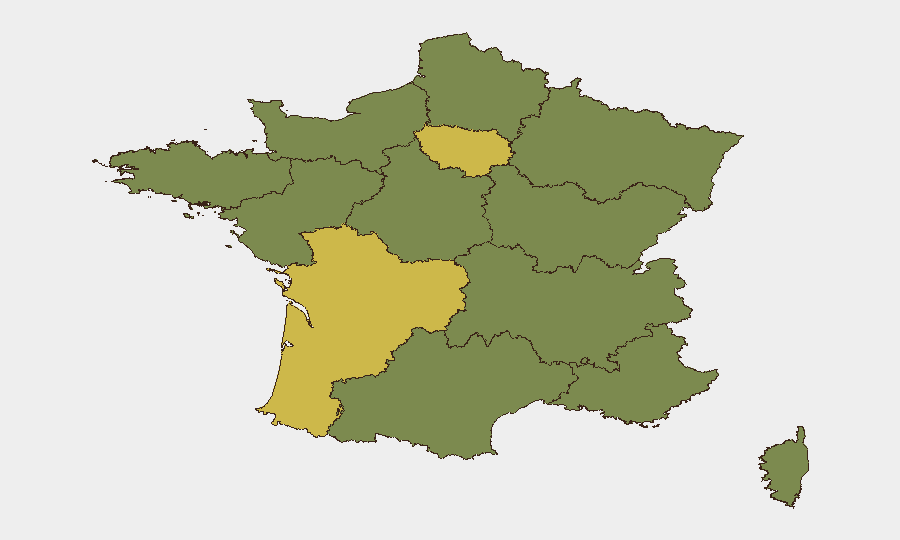
4. Interpretation of the ranking data alone: Why Nouvelle-Aquitaine (67.2) and Île-de-France (64.3) are elevated, what that typically correlates with (industrial action, organized crime, terrorism, political protest), and how to validate whether those scores are driving current incidents.
Which would be most useful?
Highest-Risk Areas — Ranked
| # | State / Region | Risk |
|---|---|---|
| 1 | Nouvelle-Aquitaine | 67.2 |
| 2 | Ile-de-France | 64.3 |
| 3 | Bourgogne – Franche-Comté | 39.1 |
| 4 | Hauts-de-France | 37.9 |
| 5 | Brittany | 37.8 |
| 6 | Occitania | 37.7 |
| 7 | Provence-Alpes-Côte d'Azur | 37.6 |
| 8 | Pays de la Loire | 37.4 |
| 9 | Normandy | 37.2 |
| 10 | Centre-Val de Loire | 37.2 |
| 11 | Grand Est | 37.2 |
| 12 | Auvergne-Rhône-Alpes | 37.2 |
Sources
Previous Daily Briefs
A new France brief is written every day — each with its own risk map and downloadable CSV. Here's the last week; use the calendar to go further back.
📅 Browse every day by calendar →
Highlighted days have a brief. Tap a day for that day's map & analysis, or “csv” for that day's dataset ($5).