Situation Summary
New Zealand remains a low-threat operating environment (global rank #163, composite score 4.0), with risk heavily concentrated in Wellington and Auckland. A significant severe-weather event on 27 June caused widespread infrastructure disruption across the central North Island and capital region, creating secondary operational challenges for organisations dependent on power and transport connectivity. No direct security incidents or violence have been reported, but utility and transport disruptions warrant contingency activation for teams in affected areas.
Key Developments
- Wellington & Central North Island – 27 June, evening: Severe windstorms and heavy rain triggered over 3,000 power outages across Wellington, Manawatū-Whanganui, and nearby districts, with downed power lines and damaged substations leaving thousands without electricity. Restoration operations were ongoing as of 28 June morning.
- Rural Central North Island – 27 June: Wind-driven tree falls blocked rural roads and damaged power infrastructure in multiple central districts; emergency services cleared debris and secured compromised lines, creating temporary road hazards and access restrictions.
- Wellington region – 27–28 June (ongoing): Local authorities and utility companies continued restoration of power distribution networks and road clearance; some customers remained without service and minor transport disruptions persisted into 28 June.
- National electricity grid – 27 June: New Zealand's distributors implemented load management and network stability measures, including supply rerouting and prioritisation of critical infrastructure (hospitals, emergency services) in storm-affected regions to prevent cascading failures.
- Rocket Lab Launch Complex 1, Māhia Peninsula (Hawke's Bay) – 05:43 NZST, 27 June: Electron launch ("Ten Owl Of Ten") executed successfully with standard maritime and airspace exclusion zones in effect; no security incidents reported, though temporary local access and flight restrictions were enforced.
- Coastal Hawke's Bay – 27 June morning: Maritime authorities maintained active safety and security zones around the Rocket Lab launch corridor to restrict small-vessel traffic during spaceflight operations.
Highest-Risk Areas
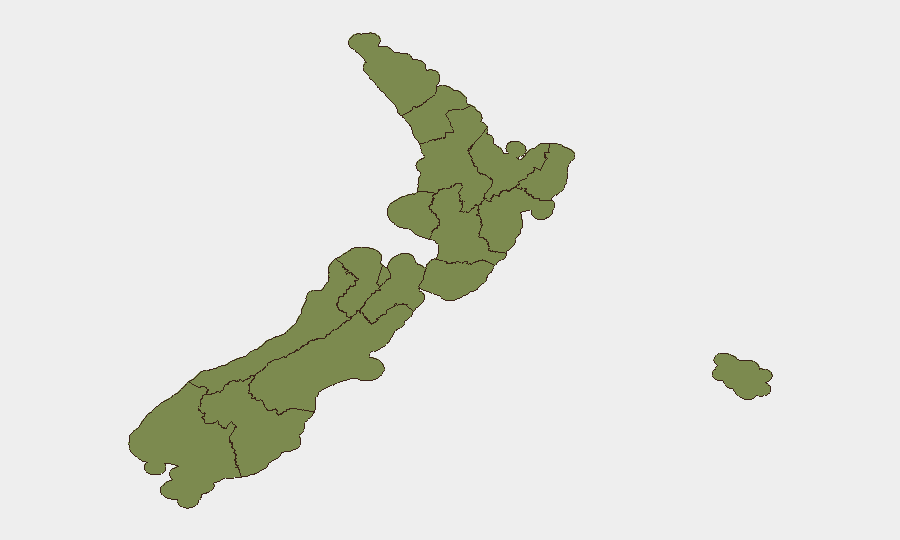
Wellington (31.9) and Auckland (27.9) dominate the national risk profile, reflecting both cities' concentration of government, finance, and critical infrastructure. Wellington's elevation on 28 June is directly tied to the 27 June storm impacts on power, transport, and utility systems. Northland (26.8) and Canterbury (23.4) present moderate elevated risks; all other regions score below 6.0. The storm-driven utility outages in Wellington and surrounding regions have temporarily increased operational risk for corporate teams reliant on continuous power and communication infrastructure, though underlying security threats remain low.
How GeoBit Would Assist
Security teams managing New Zealand operations should deploy AOI Monitoring & Early Warning capabilities to track Wellington, Auckland, and critical-infrastructure sites for emerging disruptions or secondary incidents during recovery phases. Environmental & Health intelligence feeds would provide real-time updates on weather systems, power restoration timelines, and transport route viability. Routing & Network Analysis tools enable alternative journey and supply-chain planning for teams navigating storm-affected areas, while OSINT fusion across media and official channels maintains visibility on utility recovery progress and any downstream security implications.
7-Day Outlook
The immediate 7-day window will be dominated by power and transport restoration across Wellington and central North Island regions; most services are expected to be normalised by 30 June. No escalation of underlying security threats is forecast. Teams should monitor restoration progress via local utility and transport authority updates and maintain contingency protocols for extended outages in isolated areas.
Highest-Risk Areas — Ranked
| # | State / Region | Risk |
|---|---|---|
| 1 | Wellington | 31.9 |
| 2 | Auckland | 27.9 |
| 3 | Northland | 26.8 |
| 4 | Canterbury | 23.4 |
| 5 | Manawatū-Whanganui | 5.3 |
| 6 | West Coast | 5.3 |
| 7 | Chatham Islands | 3 |
| 8 | Waikato | 3 |
| 9 | Gisborne | 3 |
| 10 | Marlborough | 3 |
| 11 | Southland | 3 |
| 12 | Taranaki | 1.9 |
Sources
Previous Daily Briefs
A new New Zealand brief is written every day — each with its own risk map and downloadable CSV. Here's the last week; use the calendar to go further back.
📅 Browse every day by calendar →
Highlighted days have a brief. Tap a day for that day's map & analysis, or “csv” for that day's dataset ($5).