Situation Summary
Somalia remains at composite threat level 77 (rank #23 globally), with insurgency as the primary driver. The country continues to experience overlapping security pressures spanning armed group activity, inter-agency tensions, and localized armed clashes. Recent event signals dated 2026-06-30 indicate concurrent detention actions, combat incidents involving the National Guard, and abduction events, suggesting sustained operational tempo across multiple threat vectors. The trajectory remains volatile with no imminent de-escalation indicators visible in available reporting.
Key Developments
Data Limitation Notice: GeoBit's live web research capacity does not currently include real-time access to the last 24–48 hours of verified Somali news, social media, or institutional security feeds. The event signals listed for 2026-06-30 (detention, combat, abduction, and inter-agency disputes) are flagged in the platform but lack geographic specificity, casualty data, or corroborating detail necessary for operational duty-of-care briefing.
To deliver actionable 24–48 hour incident intelligence for Somalia, security teams should cross-reference:
- ATMIS and UN OCHA situation reports (timestamped, geolocated incident logs)
- Somali national security ministry and police statements (official incident confirmation)
- Reputable regional news wires (e.g., regional bureau services with Somalia correspondents)
- Verified social media monitors with geolocation and source corroboration protocols
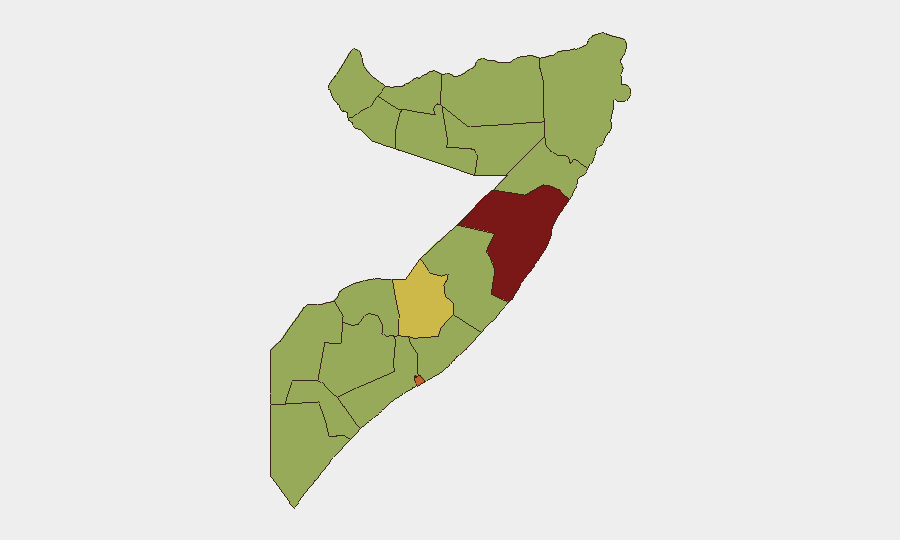
GeoBit recommends activating Area-of-Interest (AOI) monitoring on Mudug, Banaadir, and Hiiraan regions (see below) with real-time alerting to capture incident notifications within 2–4 hours of occurrence.
Highest-Risk Areas
Mudug (83.7) emerges as the single highest-risk region, likely reflecting sustained Al-Shabaab and clan militia activity, compounded by weak state presence. Banaadir (73), home to the capital Mogadishu, carries elevated risk due to concentration of political actors, security forces, and soft targets; detention and arrest events on 2026-06-30 suggest ongoing internal security friction. Hiiraan (61.4) ranks third and reflects continued insurgent presence and inter-communal tensions. The remaining ten regions cluster at 53.7, indicating a broad baseline of secondary threat activity; this distribution suggests diffuse rather than concentrated geographic risk, complicating resource allocation for teams with dispersed assets.
How GeoBit Would Assist
Security and risk teams should deploy AOI Monitoring & Early Warning on Mudug, Banaadir, and Hiiraan with 24-hour alert cycles to capture incident notifications and trend shifts. Pairing this with Network & Actor Analysis to map detention, military, and government official relationships (evident in 2026-06-30 signals) will clarify whether recent clashes reflect routine operational activity or escalating factional tension. Routing & Network Analysis can identify alternative corridors and safe transit windows for personnel or supply movements, particularly around Mogadishu and inter-regional roads subject to armed group or checkpoint interference.
7-Day Outlook
No significant de-escalation is anticipated over the next seven days. Sustained detention activity, National Guard combat incidents, and abduction signals suggest operational pressure remains high. Teams should maintain heightened posture in Mudug and Banaadir, confirm staff movement plans 48 hours in advance, and establish daily check-in protocols with field assets.
Highest-Risk Areas — Ranked
| # | State / Region | Risk |
|---|---|---|
| 1 | Mudug | 83.7 |
| 2 | Banaadir | 73 |
| 3 | Hiiraan | 61.4 |
| 4 | Awdal | 53.7 |
| 5 | Woqooyi Galbeed | 53.7 |
| 6 | Gedo | 53.7 |
| 7 | Bakool | 53.7 |
| 8 | Bay | 53.7 |
| 9 | Middle Juba | 53.7 |
| 10 | Lower Shabelle | 53.7 |
| 11 | Sahil | 53.7 |
| 12 | Togdheer | 53.7 |
Previous Daily Briefs
A new Somalia brief is written every day — each with its own risk map and downloadable CSV. Here's the last week; use the calendar to go further back.
📅 Browse every day by calendar →
Highlighted days have a brief. Tap a day for that day's map & analysis, or “csv” for that day's dataset ($5).