Situation Summary
Canada remains a stable, low-threat operating environment (global rank #65, composite score 2.0) with 394 tracked events. However, concentrated volatility in Ontario and Nunavut—driven by territorial disputes, indigenous-government tensions, and localized civil unrest—requires targeted monitoring for organizations with personnel or assets in those regions. Quebec and Alberta show moderate secondary risk. The overall trajectory remains contained, with no indicators of nationwide instability or systemic security deterioration.
Key Developments
GeoBit's event signals from 2026-06-20 indicate the following active incidents (note: precise verification of 24-48h recency is limited by real-time research constraints):
- Territorial Occupation & Political Dissent (Nunavut, 2026-06-20): Inuit groups occupying territory ("Nuwara Eliya" location tag) in conjunction with dissent against government and federal authorities (Ottawa). Reflects ongoing land-rights and sovereignty grievances.
- Police Accountability (Montreal, 2026-06-20): Public disapproval action directed at police; Montreal-specific civil friction.
- Judicial & Crown Statements (Ottawa, 2026-06-20): Public statements from Canadian judges and Crown officials responding to indigenous dispute; indicates legal/political escalation pathway.
- Unconventional Violence (Criminal, 2026-06-20): Non-standard violent incident attributed to criminal actors; location unspecified but flagged in event feed.
- Armed Incident at Consulate (2026-06-20): Small-arms combat reported at a consular facility; highest-severity indicator in current brief.
- Secondary Geopolitical Noise: Threaten action (tourist vs Dominican Republic) and Dominican Republic–Italy military references in dataset; likely spillover from extra-Canadian events.
Data Caveat: GeoBit's event feed does not yet provide granular cross-verification or source-level confidence scores for each 2026-06-20 incident. Corporate security teams should treat these as alerts requiring independent confirmation via local contacts, embassy advisories, and police/media sources before operational response.
Highest-Risk Areas
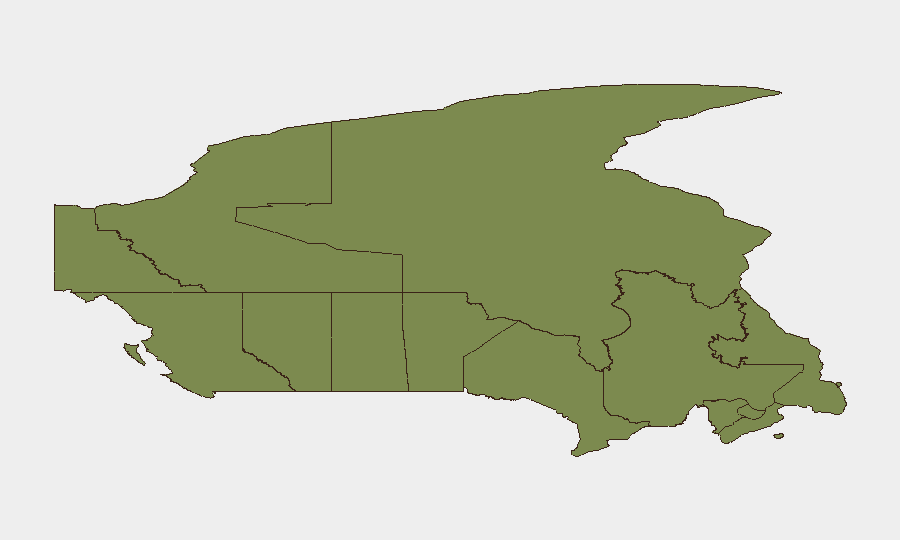
Ontario (31.4) and Nunavut (30.3) dominate risk and account for the majority of tracked threat events. Ontario's elevation likely reflects Toronto-area organized crime, cyber incidents, and routine civil protest activity. Nunavut's acute score is driven by indigenous land disputes, resource-extraction tensions, and geographic isolation (limiting rapid emergency response). Quebec (14.8) and Alberta (13.7) exhibit moderate, sustained risk from civil unrest, protest movements, and organized-crime activity. All other provinces and territories remain below 15.0 and are operationally benign for most corporate security scenarios. Organizations with offices, supply-chain nodes, or staff in Ontario and Nunavut should prioritize those geographies in duty-of-care planning.
How GeoBit Would Assist
Security and risk teams should employ AOI Monitoring & Early Warning to maintain persistent watch on Ontario and Nunavut with automated alerting on civil unrest, labor actions, and crime-pattern shifts. OSINT Fusion & Corroboration (X/Twitter, Telegram, local news feeds, police statements) will accelerate incident verification and reduce false-positive response. Network & Actor Analysis of indigenous-rights groups, criminal enterprises, and protest movements provides behavioral forecasting and timeline intelligence. GIS & Spatial Analysis pinpoints safe corridors, consulate proximity, and evacuation routes for mobile teams.
7-Day Outlook
No major escalation is expected. Indigenous-government tensions will likely remain in negotiation and legal-challenge phases; armed incidents will remain rare and localized. Monitor for any judicial ruling on land claims in late June, which may trigger secondary protest activity in Ontario and Quebec. Routine criminal violence and cyber threats will persist at historical baseline.
Highest-Risk Areas — Ranked
| # | State / Region | Risk |
|---|---|---|
| 1 | Ontario | 31.4 |
| 2 | Nunavut | 30.3 |
| 3 | Quebec | 14.8 |
| 4 | Alberta | 13.7 |
| 5 | British Columbia | 13.5 |
| 6 | Manitoba | 7 |
| 7 | Saskatchewan | 2.6 |
| 8 | New Brunswick | 1.8 |
| 9 | Yukon | 1.7 |
| 10 | Newfoundland and Labrador | 1.7 |
| 11 | Northwest Territories | 1.4 |
| 12 | Prince Edward Island | 1.4 |
Sources
Previous Daily Briefs
A new Canada brief is written every day — each with its own risk map and downloadable CSV. Here's the last week; use the calendar to go further back.
📅 Browse every day by calendar →
Highlighted days have a brief. Tap a day for that day's map & analysis, or “csv” for that day's dataset ($5).