Situation Summary
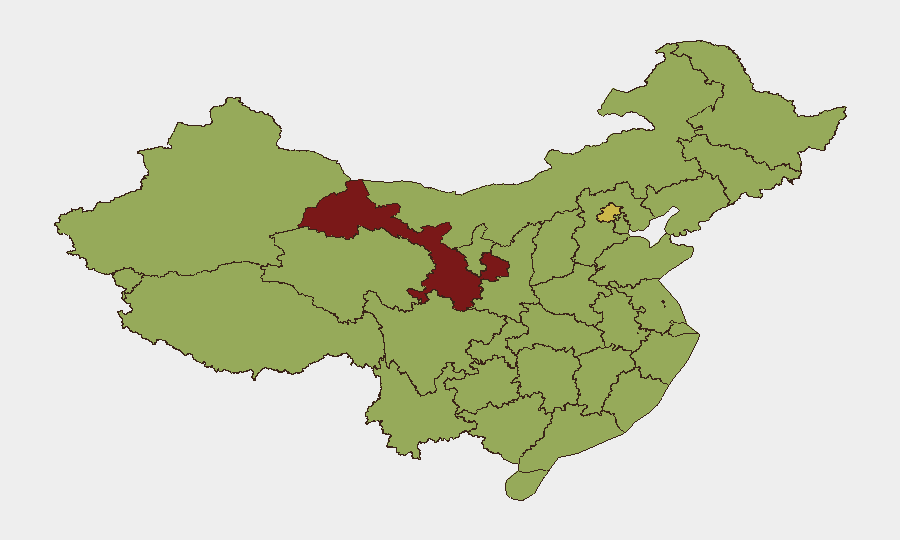
China's composite threat score (73, #20 globally) reflects elevated political and diplomatic tension rather than widespread internal instability. Recent public statements and diplomatic rejections by China, coupled with international disapproval signals, indicate strained bilateral and multilateral relations. Sub-national risk concentration in Gansu (81.2), Beijing (68.5), and Guangdong (57.8) suggests localized vulnerabilities rather than nationwide deterioration. The trajectory remains volatile but not yet acute for most corporate operations.
Key Developments
Limited current intelligence from last 24–48 hours. GeoBit's live web research was unable to confirm new China-internal security or travel incidents within the last 48 hours beyond the following:
- Yunnan Province (Kunming) — June 3 detention (confirmed post-hoc, not a 24h event) — U.S. researcher U Min Zin detained on national-security/espionage allegations; case remains active and represents ongoing diplomatic friction.
Diplomatic signal activity (June 16–18):
- Multiple public statements and disapproval signals involving China, U.S. officials, Southeast Asian actors, and international media on June 16–17 suggest heightened diplomatic friction, though specific operational impact on corporate security in-country remains unclear pending deeper source corroboration.
Note: The event signals listed reflect diplomatic posture rather than domestic security incidents (arrests, protests, or violence). Confirmation of operational relevance to China-based corporate operations requires fresh reporting from Chinese state media, international news wire services, or verified social sources.
Highest-Risk Areas
Gansu Province's elevated risk score (81.2) reflects either persistent infrastructure/border vulnerabilities or concentrated event clustering; Beijing (68.5) correlates with diplomatic and governance activities; Guangdong (57.8), Shanghai (54.7), and Jiangsu (53.5) carry moderately elevated risk tied to coastal commerce, foreign-national density, and international connectivity. The concentration of risk in tier-1 cities and western provinces suggests that exposure scales with operational footprint (Beijing, Shanghai, Guangdong) and cross-border activity (Yunnan, Gansu). Risk below 55 across most other major provinces indicates that most secondary urban centers remain within normal operational parameters for corporate security.
How GeoBit Would Assist
AOI Monitoring & Early Warning with persistent watch on Gansu, Beijing, and Guangdong would flag new arrests, protests, or security incidents in real time. Intel Sweep and multi-language OSINT fusion (state media, Telegram, X, industry channels) would corroborate diplomatic signals and identify corporate-relevant operational impacts before they escalate. Risk & Threat Assessment linked to live event feeds and sentiment analysis would enable duty-of-care teams to distinguish diplomatic noise from actionable threats to personnel and assets.
7-Day Outlook
Diplomatic friction is likely to persist through the near term; watch for Chinese public statements or new bilateral rejections as indicators of escalation depth. Operational risk to corporate personnel in major cities remains moderate absent new internal-security incidents; however, the U Min Zin case and any related foreign-national detentions would warrant immediate review of visa compliance, researcher protocols, and travel approvals. Recommend escalating AOI monitoring on Yunnan and Beijing pending clarification of detention charges and any downstream regulatory changes.
Highest-Risk Areas — Ranked
| # | State / Region | Risk |
|---|---|---|
| 1 | Gansu | 81.2 |
| 2 | Beijing | 68.5 |
| 3 | Guangdong Province | 57.8 |
| 4 | Shanghai | 54.7 |
| 5 | Jiangsu | 53.5 |
| 6 | Yunnan | 52.9 |
| 7 | Tibet | 52.7 |
| 8 | Tianjin | 52.6 |
| 9 | Ningxia | 52.4 |
| 10 | Jilin | 52.1 |
| 11 | Fujian | 51.9 |
| 12 | Sichuan | 51.8 |
Sources
Previous Daily Briefs
A new China brief is written every day — each with its own risk map and downloadable CSV. Here's the last week; use the calendar to go further back.
📅 Browse every day by calendar →
Highlighted days have a brief. Tap a day for that day's map & analysis, or “csv” for that day's dataset ($5).