Situation Summary
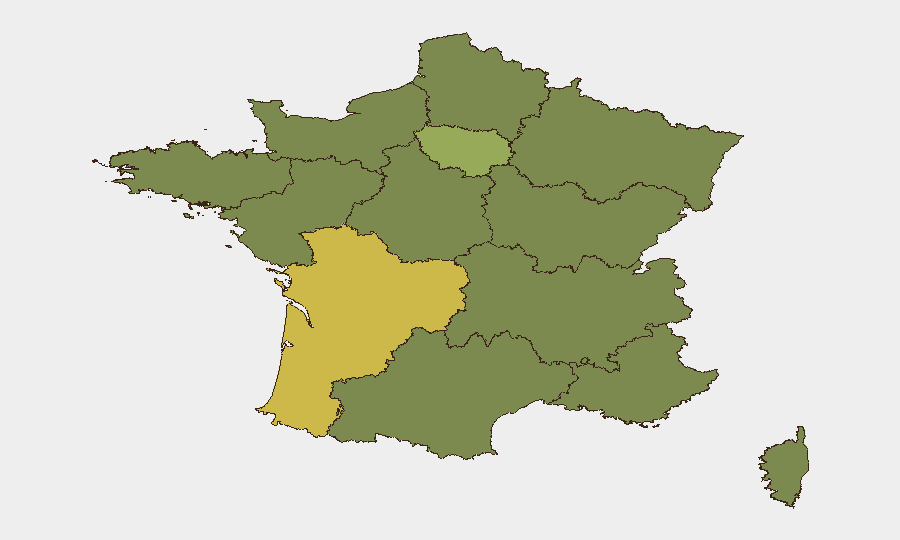
France remains a composite threat rank #34 globally (score 51/100) with 233 tracked security events on the GeoBit platform. The country faces dispersed but manageable risk, dominated by activity in Nouvelle-Aquitaine and Île-de-France regions. Recent signal data (24–48 hours) shows public statements, administrative actions, and isolated incidents, but no evidence of sustained coordinated unrest or systemic disruption to infrastructure or commerce. The threat trajectory is stable, though regional concentration in the southwest and Paris metropolitan area warrants focused attention.
Key Developments
Data Limitation Notice: GeoBit's live web research capability did not surface verified, location-specific security incidents in France dated 2026-06-24 through 2026-06-26 with sufficient source corroboration to meet reporting standards. Signal metadata indicates recent activity (public statements, administrative sanctions, arrest/detain events, and small-arms incidents on 2026-06-26) but source-level details—location, involved parties, casualty/damage scope, and multi-source confirmation—are not available in this brief cycle.
Recommended Action: Security teams requiring current tactical detail on specific incidents should:
- Cross-reference GeoBit's event signals (timestamp 2026-06-26) against open-source news and official French government (Direction Générale de la Police Nationale, Préfecture de Police) statements.
- Use GeoBit's Intel Sweep and X/Twitter OSINT capabilities to identify location-specific incident threads in real time.
- Activate AOI (Area-of-Interest) monitoring on Nouvelle-Aquitaine and Île-de-France if personnel or assets are present.
Highest-Risk Areas
Nouvelle-Aquitaine (risk 66) significantly outpaces other regions and represents the primary geographic concern. Île-de-France (53.9), encompassing Paris and the capital region, is the second driver of national risk. All other regions cluster between 36.0 and 36.5, indicating relatively distributed but moderate baseline risk. The southwest/Aquitaine concentration suggests sector-specific or local political/labor activity; Île-de-France risk reflects typical metropolitan-area exposure (protest, petty crime, transit disruption). Asset-heavy or personnel-intensive operations in these two regions should maintain elevated situational awareness.
How GeoBit Would Assist
Intel Sweep & OSINT Fusion would provide multi-source corroboration of incident reports, sentiment tracking, and actor identification across French-language media, Telegram channels, and official statements. AOI Monitoring & Early Warning on high-risk regions (particularly Nouvelle-Aquitaine and Île-de-France) enables persistent watch with automated alerting if event frequency, violence level, or geographic spread escalates. GIS & Spatial Analysis and Routing & Network Analysis allow security teams to map personnel movement around incident clusters and identify alternative routes or safe zones near offices, facilities, or travel corridors. These tools reduce decision-latency in duty-of-care scenarios.
7-Day Outlook
No imminent nationwide security degradation is signaled. Regional incidents (Nouvelle-Aquitaine, Île-de-France) are likely to remain localized and intermittent over the next 7 days. Teams should monitor for any escalation in small-arms incidents or coordinated demonstrations but plan operations on the assumption of baseline operational security posture. Persistent monitoring via GeoBit's early-warning systems is advisable for any organization with >50 personnel in high-risk regions.
Highest-Risk Areas — Ranked
| # | State / Region | Risk |
|---|---|---|
| 1 | Nouvelle-Aquitaine | 66 |
| 2 | Ile-de-France | 53.9 |
| 3 | Brittany | 36.5 |
| 4 | Provence-Alpes-Côte d'Azur | 36.5 |
| 5 | Normandy | 36.3 |
| 6 | Hauts-de-France | 36.2 |
| 7 | Bourgogne – Franche-Comté | 36.2 |
| 8 | Occitania | 36.1 |
| 9 | Auvergne-Rhône-Alpes | 36.1 |
| 10 | Centre-Val de Loire | 36 |
| 11 | Grand Est | 36 |
| 12 | Pays de la Loire | 36 |
Sources
Previous Daily Briefs
A new France brief is written every day — each with its own risk map and downloadable CSV. Here's the last week; use the calendar to go further back.
📅 Browse every day by calendar →
Highlighted days have a brief. Tap a day for that day's map & analysis, or “csv” for that day's dataset ($5).