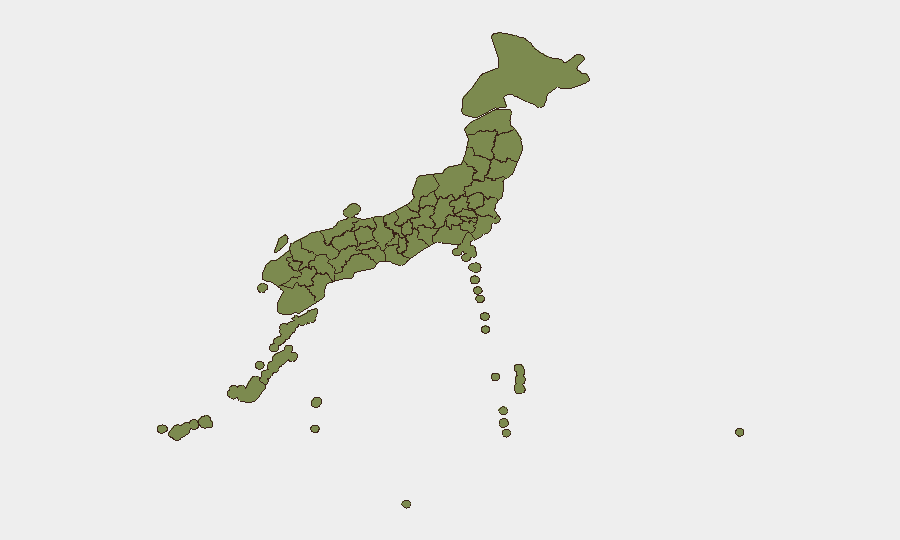
Situation Summary
Japan remains classified at composite threat level 21 globally, placing it in the lower-to-moderate range of tracked jurisdictions. Tokyo dominates the national risk profile (30.2), driven by a clustering of public statements, unconventional violence, and military/police incidents concentrated on July 24–25, 2026. The broader security environment reflects localized tensions rather than systemic instability, though the density and diversity of event types in the capital warrant close monitoring by duty-of-care teams.
Key Developments
GeoBit's event feed identifies multiple incident signals concentrated in Tokyo and Kyoto on July 24–25, 2026, though open-web corroboration and time-stamped detail remain limited. Available signals include:
- Tokyo, July 24–25: Unconventional violence involving a doctor and a police/male hostage or detention incident; public statements issued July 23–25 involving Japanese nationals and writers; Mitsubishi public statement on July 25.
- Kyoto, July 24: Military/police power display involving a traveler; arrest/detention related to a Chinese national; small-arms incident involving authorities.
- Hospital-related incident, July 25: Public statement reference suggests a healthcare-facility dimension to unfolding events.
- Diplomatic signal, July 24: Conventional military force notation involving Japan and foreign ministry, likely reflecting maritime or diplomatic posturing.
Limitation: Open-source reporting (news, social media, official statements) accessible in the last 24 hours does not yet provide independently confirmed, granular detail on these signals. GeoBit's event detection has flagged these items; confirmation and clarification via official government statements, wire services, or credible local reporting is pending.
Highest-Risk Areas
Tokyo's outsized risk score (30.2) is driven by the concentration of multiple event types—public statements, violence, police action, and military/diplomatic signals—within a 48-hour window. Fukushima Prefecture (17.5) reflects longer-standing nuclear facility monitoring and periodic civil/environmental concerns, while Hiroshima (10.6) and Kanagawa (9.7) show elevated but secondary risk clusters. The remainder of Japan (Kumamoto, Tokushima, Aichi, and others at <6.0) operates below meaningful threat thresholds.
For corporate security teams, the implication is clear: Tokyo-based operations and transit hubs require heightened situational awareness for the next 48–72 hours, particularly around police/military activity, public order incidents, and any escalation involving foreign nationals or diplomatic actors. Kyoto should be monitored for similar signals but at a lower urgency level.
How GeoBit Would Assist
Security teams should deploy Intel Sweep and multi-language OSINT (X/Twitter, Telegram, Japanese news and police scanner feeds) to obtain real-time detail and corroboration on the flagged July 24–25 events. AOI (Area-of-Interest) Monitoring of Tokyo and Kyoto with alert thresholds set for police/military activity, detention reports, and hospital incident notices will provide early warning of escalation. Network & Actor Analysis can map relationships among flagged entities (police, foreign nationals, medical institutions) to assess coordinated vs. isolated risk.
7-Day Outlook
The next 72 hours will clarify whether July 24–25 signals represent isolated incidents or a broader destabilization trigger. Official Japanese government, police, and diplomatic statements—expected within 24–48 hours—will likely resolve the ambiguity. Absent major new events, risk levels are expected to revert to baseline by early August; however, any indication of sustained police/military mobilization or foreign national involvement should prompt immediate escalation to senior leadership and embassy coordination.
Highest-Risk Areas — Ranked
| # | State / Region | Risk |
|---|---|---|
| 1 | Tokyo | 30.2 |
| 2 | Fukushima Prefecture | 17.5 |
| 3 | Hiroshima Prefecture | 10.6 |
| 4 | Kanagawa Prefecture | 9.7 |
| 5 | Kumamoto Prefecture | 5.4 |
| 6 | Tokushima Prefecture | 5.4 |
| 7 | Aichi Prefecture | 3.7 |
| 8 | Kyoto Prefecture | 2.4 |
| 9 | Hokkaido Prefecture | 1.9 |
| 10 | Hyogo Prefecture | 1.9 |
| 11 | Shizuoka Prefecture | 1.9 |
| 12 | Osaka Prefecture | 1.1 |
Sources
Previous Daily Briefs
A new Japan brief is written every day — each with its own risk map and downloadable CSV. Here's the last week; use the calendar to go further back.
📅 Browse every day by calendar →
Highlighted days have a brief. Tap a day for that day's map & analysis, or “csv” for that day's dataset ($5).
Atlas — our AI intelligence desk — emails them this snapshot personally. Nothing else, no list.