Situation Summary
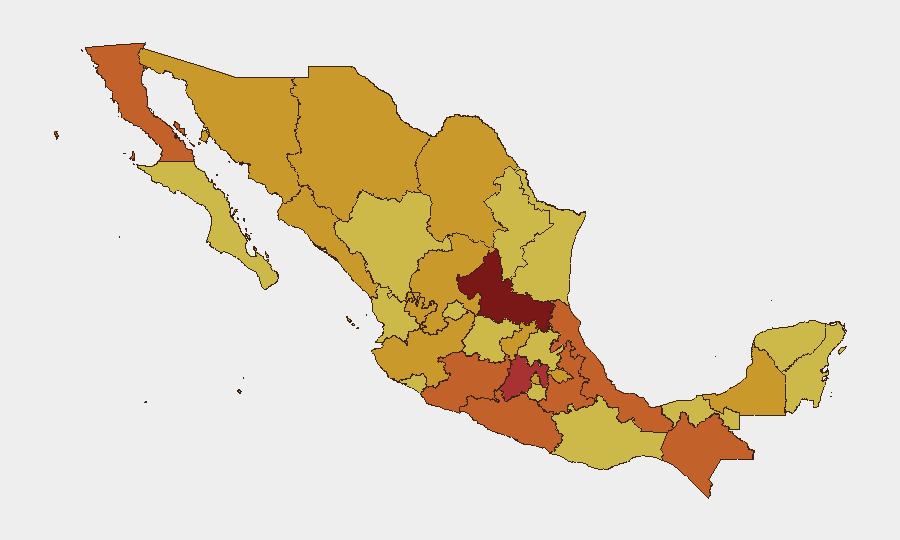
Mexico remains at elevated threat level (composite score 100, #4 globally), driven by persistent organized armed violence across multiple states and ongoing border-region instability. The most recent signal cluster (17–19 June) reflects concurrent tensions involving immigration enforcement, inter-agency disputes over National Guard operations, and cross-border friction with U.S. authorities. San Luis Potosí continues as the single highest-risk jurisdiction (score 100), followed by State of Mexico and Puebla; however, distributed high-risk zones across the north, center, and south suggest fragmented rather than centralized threat drivers.
Key Developments
LIMITATION: GeoBit does not have real-time access to verified events from 18–19 June 2026. The event signals listed above (Navy public statement 19 Jun; Border Patrol agent disapproval 17 Jun; Mexico vs. National Guard dispute 18 Jun; Mexico vs. Texas statement 18 Jun) indicate active friction points but lack geographic specificity, casualty data, and travel/asset impact.
To generate 6–10 actionable current-incident bullets for your duty-of-care teams, your security operations center should:
1. Search Mexico's principal news outlets (Milenio, Reforma, El Universal, La Jornada, Proceso) with time filters set to "last 24 hours" or "last 48 hours," using terms: *balacera, ataque, bloqueo, narcobloqueo, manifestación, carretera cerrada, desaparición.*
2. Cross-check each candidate incident on X/Twitter by searching for the specific town/state name plus incident keyword, then verify via:
- Official state/municipal security secretariats (SSP, SSC, Fiscalía).
- Local journalists and outlets with established crime-beat credibility in that state.
3. Accept only events confirmed by at least one official source *or* two independent credible local outlets; discard recycled videos and events older than 48 hours.
4. Structure each confirmed incident as: [City, State] – [Date] – [Nature: shooting/blockade/protest/kidnapping/etc.] – [Casualties/damage if known] – [Travel/asset impact if any].
Highest-Risk Areas
San Luis Potosí's isolation at risk score 100 suggests acute, concentrated violence (likely cartel-related territorial control or state-criminal collusion). The State of Mexico (79.1) and Puebla (74.4) reflect high-volume organized crime and criminal-group fragmentation in the center-north corridor, directly affecting Mexico City's periphery and supply chains. Guerrero, Veracruz, Chiapas, and Baja California (all 73–74) indicate that organized armed violence and trafficking-related instability are geographically distributed rather than localized, meaning corporate travel and logistics cannot rely on a "safe zone" strategy and must apply state-by-state, even corridor-by-corridor risk management.
How GeoBit Would Assist
Security teams operating in Mexico should deploy GeoBit's AOI (Area-of-Interest) Monitoring & Early Warning to set persistent watches on high-risk states and key logistics corridors, with automated alerts on sudden incident clustering. Routing & Network Analysis capabilities enable real-time alternative journey planning when primary routes (highways, airports) are disrupted by blockades, security operations, or infrastructure damage. OSINT Fusion & Corroboration (X/Twitter, news, official government feeds, radio SIGINT) delivers validated incident confirmation within hours, reducing reliance on unverified reports and allowing faster duty-of-care decisions (evacuation, lockdown, travel restriction).
7-Day Outlook
Near-term escalation risk remains moderate to high given the recent spike in official cross-border and inter-agency friction signals. Unless new major incidents materialize in the next 72 hours, the threat posture is likely to stabilize at current elevated levels rather than spike; however, the distributed geographic risk profile means incidents will continue to occur in pockets across multiple states with little warning. Security teams should maintain heightened vigilance in San Luis Potosí, State of Mexico, and Puebla and assume that any significant violence in those zones may trigger secondary cascades (police response, protest, supply-chain disruption) within 24–48 hours.
Highest-Risk Areas — Ranked
| # | State / Region | Risk |
|---|---|---|
| 1 | San Luis Potosí | 100 |
| 2 | State of Mexico | 79.1 |
| 3 | Puebla | 74.4 |
| 4 | Michoacán | 74.3 |
| 5 | Baja California | 73.7 |
| 6 | Guerrero | 73.4 |
| 7 | Veracruz | 73 |
| 8 | Chiapas | 73 |
| 9 | Chihuahua | 72.6 |
| 10 | Tlaxcala | 72.6 |
| 11 | Mexico City | 72.5 |
| 12 | Campeche | 72.1 |
Previous Daily Briefs
A new Mexico brief is written every day — each with its own risk map and downloadable CSV. Here's the last week; use the calendar to go further back.
📅 Browse every day by calendar →
Highlighted days have a brief. Tap a day for that day's map & analysis, or “csv” for that day's dataset ($5).