Situation Summary
New Zealand remains a low-threat environment globally (rank #164, composite score 4) with no major security incidents or civil unrest reported in the past 48 hours. Routine law enforcement, weather, and administrative activity continue across regions. Wellington and Auckland carry elevated composite risk scores (31.5 and 27.5 respectively), likely reflecting urban concentration, protest activity history, and government/institutional presence rather than active acute threats. The threat environment is stable and unlikely to change materially in the near term absent significant external triggering events.
Key Developments
No clearly time-stamped, well-sourced security, crime, or civil-unrest incidents specific to New Zealand have been confirmed from open-web sources within the 24–48 hours preceding 2026-06-29 00:00 UTC.
Background context (not current developments): A powerful storm affected Wellington on 2026-06-26, disrupting flights and infrastructure; assorted routine Fire and Emergency responses were logged in the North Region (e.g., Albany, Auckland on 2026-06-24). GEOBIT's event signals flag multiple June 26 public statements across Auckland, government, education, and industry sectors, as well as an investigation flagged in Wellington on the same date; however, specific incident details, confirmation status, and relevance to corporate security or duty-of-care risk are not yet indexed in available open sources.
Corporate security teams with personnel or assets in New Zealand should monitor official channels (NZ Police, Fire and Emergency NZ, Ministry of Health) and local media for any clarification of the June 26–28 signals, particularly any government–business disputes, health advisories, or civil-unrest indicators in the Wellington and Auckland corridors.
Highest-Risk Areas
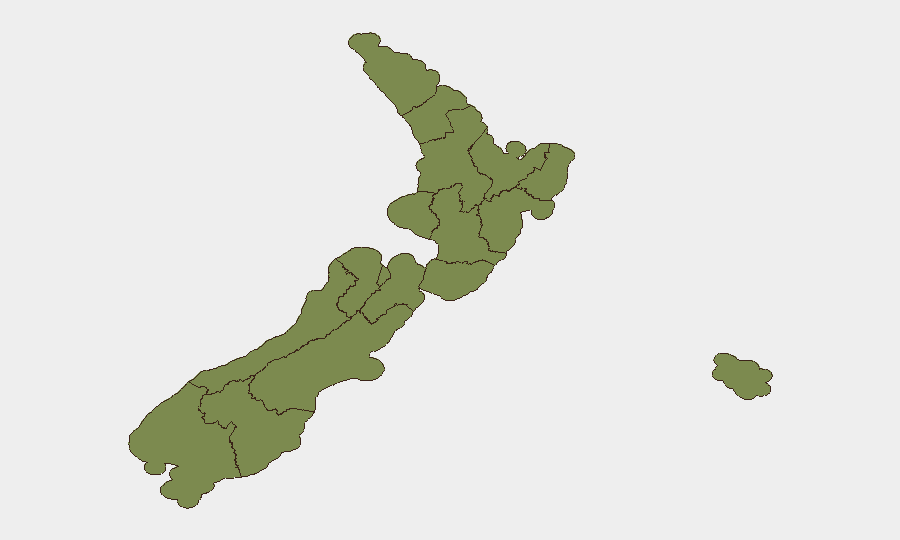
Wellington (31.5) and Auckland (27.5) are substantially elevated above all other regions, reflecting their status as primary political, commercial, and institutional hubs. Northland (26.4) and Canterbury (23) also merit attention. These rankings likely reflect historical protest activity, government presence, higher crime baseline in urban environments, and media/institutional visibility rather than imminent acute threats. All other regions score materially lower (2.6–4.9 range), indicating concentrated risk in the northern and central urban zones. Corporate operations in Wellington and Auckland should maintain heightened situational awareness and contingency protocols for civil unrest, protest activity, or government-initiated measures; regional operations face lower baseline exposure.
How GeoBit Would Assist
Intel Sweep & OSINT Fusion would consolidate real-time feeds from NZ Police, Fire and Emergency, local media, and social platforms (X, Telegram, YouTube) to clarify the June 26–28 signal cluster and detect emerging civil unrest or protest activity. AOI Monitoring & Early Warning with persistent geographic watch over Wellington and Auckland would provide alerting on demonstration permits, roadway closures, or security incidents affecting employee commute and site access. Risk & Threat Assessment and Routing & Network Analysis would enable security teams to model alternative commute corridors, supplier routes, and evacuation pathways in both high-risk metro areas, ensuring continuity of duty-of-care protocols.
7-Day Outlook
No escalation is anticipated in the near term absent clarification of the June 26–28 signals. Routine winter weather in the southern hemisphere may produce localized disruption (transport, utility). Security teams should await official statement clarification from NZ government and health ministries, and maintain standard monitoring of protest calendars and permit notifications in Wellington and Auckland through early July.
Highest-Risk Areas — Ranked
| # | State / Region | Risk |
|---|---|---|
| 1 | Wellington | 31.5 |
| 2 | Auckland | 27.5 |
| 3 | Northland | 26.4 |
| 4 | Canterbury | 23 |
| 5 | Manawatū-Whanganui | 4.9 |
| 6 | West Coast | 4.9 |
| 7 | Chatham Islands | 2.6 |
| 8 | Waikato | 2.6 |
| 9 | Gisborne | 2.6 |
| 10 | Marlborough | 2.6 |
| 11 | Southland | 2.6 |
| 12 | Taranaki | 1.5 |
Sources
Previous Daily Briefs
A new New Zealand brief is written every day — each with its own risk map and downloadable CSV. Here's the last week; use the calendar to go further back.
📅 Browse every day by calendar →
Highlighted days have a brief. Tap a day for that day's map & analysis, or “csv” for that day's dataset ($5).