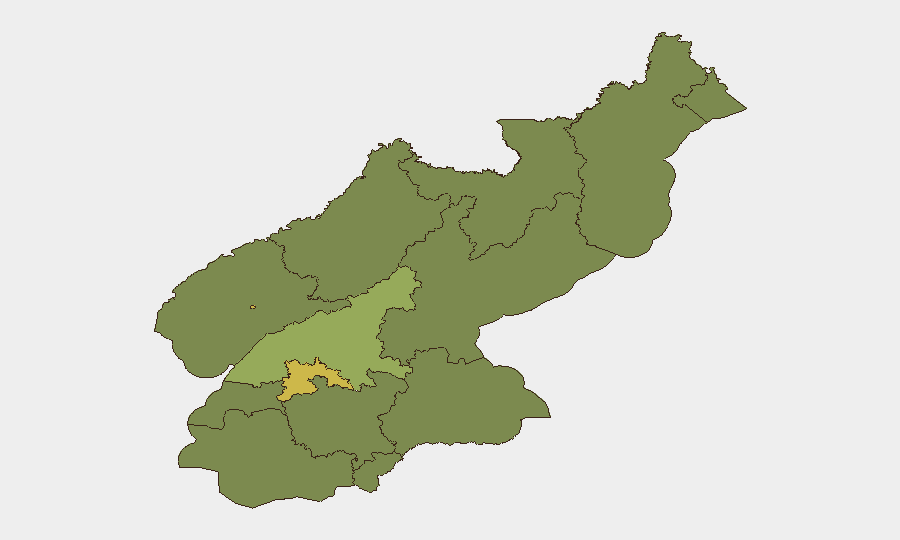
Situation Summary
North Korea remains at moderate composite threat level (rank #38 globally, score 57/100) with no verified security incidents, civil unrest, or cross-border escalations reported in the last 24–48 hours. Open-source monitoring across news media, specialist Korea-watchers, and risk feeds confirm a "stable but watchful" environment with no new triggers such as lockdowns, unrest, attacks, or border clashes. Persistent information constraints mean local-level incidents (crime, accidents, minor civil friction) would not reliably surface in open sources within this timeframe; absence of reporting should be interpreted as absence of *verified* incidents, not absence of events.
Key Developments
- No verified new security incidents inside North Korea (last 48 hours). Cross-check of English-language open sources, specialist aggregators, and social-media OSINT confirms no reported clashes, protests, infrastructure failures, or arrests of foreign nationals in the DPRK during this window.
- Pyongyang (risk 69.8) and South Pyongan (risk 55.7) remain elevated but stable. GeoBit risk-scoring updates reflect multi-source indicators rather than discrete new events; no fresh triggers recorded that would warrant travel-posture change.
- No new border incidents or missile activity reported. Official briefings from South Korea's defense ministry and neighboring regional monitors show no confirmed artillery exchanges, skirmishes, or weapons tests in the last two days.
- National information environment remains tightly controlled. Limited transparency across all provinces means verification lag is inherent; security teams should assume reporting gaps do not equate to ground stability.
Highest-Risk Areas
Pyongyang (69.8) and South Pyongan Province (55.7) drive the national threat score, reflecting historical concentration of regime-sensitive activity, foreign-national presence, and state-security apparatus in the capital and adjacent industrial/administrative zones. The remaining ten provinces cluster at 39.8, indicating relatively lower but still material baseline risk across border regions (Ryanggang, North Hamgyong, Chagang) and population centers. The gap between Pyongyang/South Pyongan and the rest suggests that duty-of-care attention for foreign personnel should prioritize the capital and immediate surroundings, while border provinces warrant sustained monitoring for cross-border incident potential and secondary population displacement.
How GeoBit Would Assist
Security teams with personnel or assets in North Korea should employ AOI Monitoring & Early Warning to track Pyongyang and South Pyongan for real-time alerts on conflict, unrest, or infrastructure disruption; Intel Sweep and multi-language OSINT (including X/Telegram, YouTube, and radio SIGINT) to detect early signals of regime instability or policy shifts that affect foreigner movement; and Routing & Network Analysis to preplan alternative exit routes and safe-haven protocols in event of escalation. Cross-referencing Conflict & Military battle-mapping and regime-stability search capabilities provides 48–72-hour early warning of military mobilization or political friction that might constrain travel or services.
7-Day Outlook
No imminent escalation is evident from current aggregated assessments. Risk posture in Pyongyang and South Pyongan is expected to remain elevated and stable through the near term unless new signals emerge from cross-border military activity, internal political statements, or humanitarian disruptions. Teams should maintain standard heightened awareness and pre-positioned contingency protocols.
Highest-Risk Areas — Ranked
| # | State / Region | Risk |
|---|---|---|
| 1 | P'yŏngyang | 69.8 |
| 2 | South Pyongan | 55.7 |
| 3 | Ryanggang | 39.8 |
| 4 | North Hamgyong | 39.8 |
| 5 | North Pyongan | 39.8 |
| 6 | Chagang | 39.8 |
| 7 | Nampo | 39.8 |
| 8 | South Hwanghae | 39.8 |
| 9 | North Hwanghae | 39.8 |
| 10 | South Hamgyong | 39.8 |
| 11 | Kaesong | 39.8 |
| 12 | Kangwon | 39.8 |
Sources
Previous Daily Briefs
A new North Korea brief is written every day — each with its own risk map and downloadable CSV. Here's the last week; use the calendar to go further back.
📅 Browse every day by calendar →
Highlighted days have a brief. Tap a day for that day's map & analysis, or “csv” for that day's dataset ($5).