Situation Summary
South Africa remains at composite threat rank #71 globally (score 15), with 3,956 tracked events in the current monitoring period. The security environment is heavily concentrated in Gauteng province, which carries a risk score of 32.1—more than double that of any other region—driven by urban crime, civil unrest, and institutional instability. Recent signals indicate ongoing government investigations, regulatory scrutiny, and high-court activity; a UN–South Africa cooperation framework was signed on 10 July, reflecting strategic-level engagement but not immediate acute risk. The overall trajectory remains volatile but localized.
Key Developments
- 10 July 2026 – Nationwide (Pretoria): South African government and UN signed a five-year cooperation framework covering governance, social cohesion, and climate resilience. This is a diplomatic milestone rather than a security incident, but signals continued institutional engagement and potential policy shifts in the coming months.
- 9 July 2026 – Multiple signals (location unspecified): Demand, investigation, and statement activity detected across intelligence, ministerial, regulatory, prosecutorial, and company actors. The event signals suggest ongoing institutional scrutiny and formal processes, but open sources do not yet confirm specific incident locations or public details beyond government action.
- 9 July 2026 – Institutional tension (location unspecified): Company–versus–student demand and government rejection of an unspecified proposal registered in event feeds. Context remains limited in open sources; nature and location require further confirmation.
- 9 July 2026 – Cross-border incident (location unspecified): Conventional military force engagement involving foreign nationals and migrants was recorded. Specifics—location, parties, and casualties—are not yet available in reliable open-source channels.
Note: GeoBit's live web research (last 24 hours) has not yet surfaced verifiable, localized incident reports (date, place, type) for the period 9–11 July 2026 beyond the diplomatic and institutional signals listed above. Event-feed signals indicate activity; full corroboration and geographic/operational detail are pending.
Highest-Risk Areas
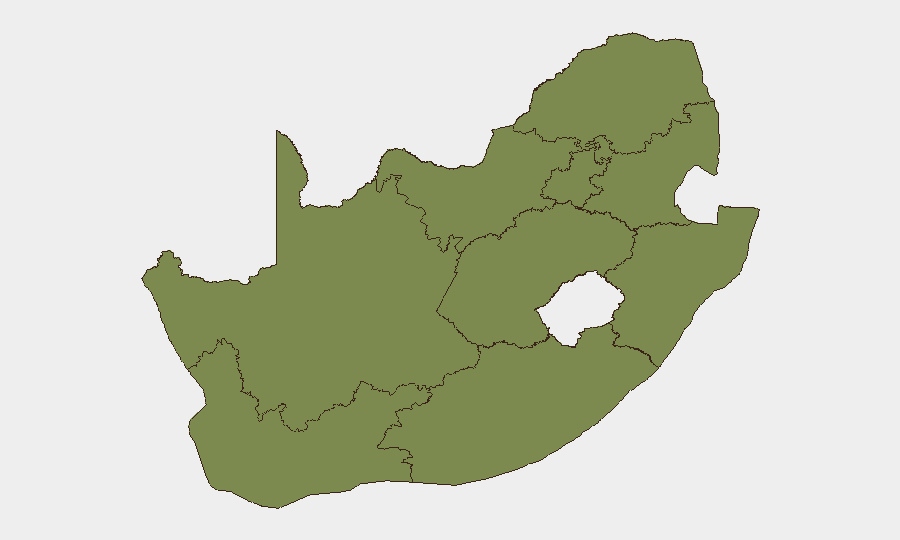
Gauteng dominates the risk landscape, with a score of 32.1—nearly 2.4 times the national average and 3× higher than Free State (13.6), the second-ranked region. This concentration reflects Johannesburg and Pretoria's role as economic and administrative hubs, where crime, labor unrest, service-delivery protests, and political tension intersect. Eastern Cape (11.8) and North West (10.0) show secondary elevation, likely driven by ongoing criminal activity and inter-factional conflict. Western Cape (7.0), despite hosting Cape Town, is substantially lower, suggesting more resilient institutional controls and lower overt conflict. Companies and personnel in Gauteng should expect elevated baseline risk; operations elsewhere remain manageable but require regional context.
How GeoBit Would Assist
Security teams should employ AOI (Area-of-Interest) Monitoring & Early Warning with persistent watch on Gauteng's major urban centers (Johannesburg, Pretoria, surrounding logistics corridors) to catch emerging protests, civil unrest, or crime spikes in real time. Intel Sweep and multi-language OSINT fusion across local news, government statements, and social platforms (X, Telegram, community radio) will surface incident detail and actor intent faster than traditional open web search. Routing & Network Analysis should be run for all personnel and asset movements in Gauteng to identify alternative routes around high-risk corridors during elevated periods.
7-Day Outlook
The institutional activity recorded on 9–10 July—investigations, high-court statements, and government rejections—suggests ongoing policy or governance tension. Gauteng will remain the focal point; watch for clarity on the "company versus student" demand and the cross-border military incident as these cases progress. No indicators of imminent nationwide instability are present, but localized flash incidents (protests, crime spikes, industrial action) in Gauteng remain a baseline risk through mid-month.
Highest-Risk Areas — Ranked
| # | State / Region | Risk |
|---|---|---|
| 1 | Gauteng | 32.1 |
| 2 | Free State | 13.6 |
| 3 | Eastern Cape | 11.8 |
| 4 | North West | 10 |
| 5 | KwaZulu-Natal | 9.6 |
| 6 | Western Cape | 7 |
| 7 | Limpopo | 2.1 |
| 8 | Northern Cape | 2.1 |
| 9 | Mpumalanga | 2.1 |
Sources
Previous Daily Briefs
A new South Africa brief is written every day — each with its own risk map and downloadable CSV. Here's the last week; use the calendar to go further back.
📅 Browse every day by calendar →
Highlighted days have a brief. Tap a day for that day's map & analysis, or “csv” for that day's dataset ($5).
Atlas — our AI intelligence desk — emails them this snapshot personally. Nothing else, no list.