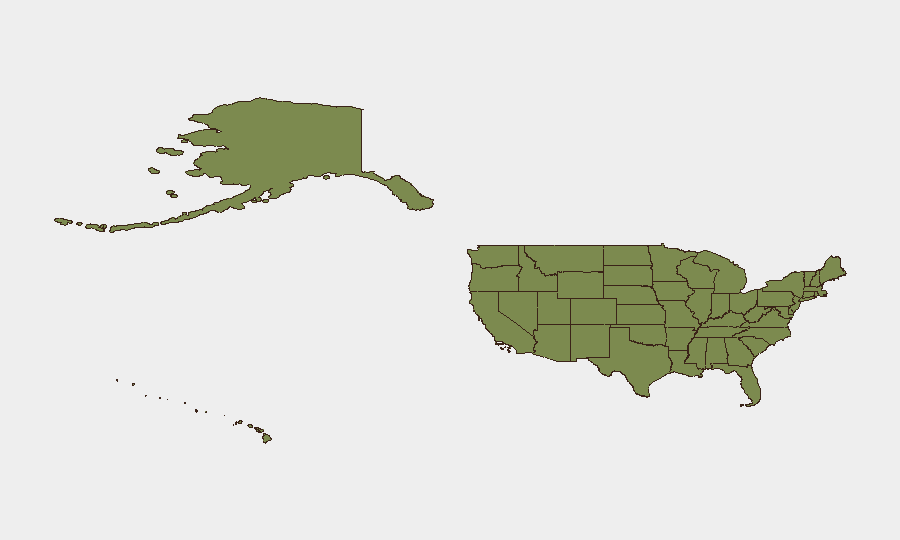
Situation Summary
The United States faces a composite threat score of 24 (global rank #65), with 7,063 tracked events reflecting fragmented domestic tensions spanning political rhetoric, law-enforcement incidents, aviation security disruptions, and environmental hazards. California dominates sub-national risk (32.5), followed by Texas (22.8) and Kansas (20.8), driven by a combination of civil unrest, criminal activity, and operational disruptions. The threat environment is elevated but not acute; risk is concentrated geographically and tactically rather than systemic.
Key Developments
- World Cup aviation security: U.S. agencies seized 50+ drones near FIFA World Cup venues on 18–19 June, with 150+ drone incidents recorded in prohibited airspace across eight game locations. This represents an ongoing disruption to venue security and travel corridors during high-attendance events.
- National wildfire escalation (19 June): The National Interagency Fire Center raised the National Preparedness Level to 3, citing 74 new fires on 18 June and 27 currently uncontained large fires. Fire-related disruptions are expected to affect transportation, air quality, and evacuation protocols across multiple regions.
- White House grounds conspiracy charges (18 June): Federal authorities announced charges related to a conspiracy to commit murder and violence on White House grounds, resulting from an arrest operation. This reflects elevated attention to proximity threats against high-value federal assets.
- Law enforcement engagement (19 June): A small-arms combat incident between police and residents was recorded, though location and casualty details remain limited in available reporting.
- Massachusetts benefit-fraud prosecution (18 June): The Department of Justice charged 15 individuals in a $1.4 million scheme involving SNAP, MassHealth, Social Security disability, housing assistance, and unemployment benefits—indicating elevated criminal exploitation of federal programs.
- Congressional and administrative friction (17 June): Public statements from a Senator versus the President and disapproval statements from the Administration versus Illinois suggest ongoing political polarization affecting federal-state coordination.
Highest-Risk Areas
California (32.5) and Texas (22.8) drive the highest composite threat scores, reflecting large populations, diverse threat vectors (civil unrest, criminal activity, organized illegal activity), and significant infrastructure targets. Kansas (20.8) and New York (20.6) show elevated risk from specific incidents and concentrated urban populations. Florida, Ohio, and Illinois contribute secondary risk layers driven by localized law-enforcement incidents and administrative friction. Risk is dispersed across urban centers and does not indicate a cohesive national emergency.
How GeoBit Would Assist
Security teams managing U.S. personnel or assets should deploy Intel Sweep and OSINT fusion capabilities to monitor event clustering in high-risk states, particularly California, Texas, and New York. AOI monitoring and early-warning alerting on World Cup venue corridors, federal facilities, and critical infrastructure would provide real-time notification of emerging threats. Routing and network analysis tools enable alternative journey planning for personnel transiting high-risk regions, and conflict and incident mapping supports rapid assessment of safe operating zones around law-enforcement or civil unrest events.
7-Day Outlook
The threat environment is expected to remain fragmented over the next seven days, with World Cup security operations continuing to strain aviation authorities and drone-detection resources. Wildfire activity will likely intensify in fire-season regions, compounding travel and air-quality risks. No cohesive national escalation is forecast, but geographically concentrated incidents in California, Texas, and New York warrant sustained monitoring and contingency planning.
Highest-Risk Areas — Ranked
| # | State / Region | Risk |
|---|---|---|
| 1 | California | 32.5 |
| 2 | Texas | 22.8 |
| 3 | Kansas | 20.8 |
| 4 | New York | 20.6 |
| 5 | Florida | 13.1 |
| 6 | Ohio | 11.4 |
| 7 | Illinois | 10.4 |
| 8 | Mississippi | 8.9 |
| 9 | Georgia | 8.2 |
| 10 | Pennsylvania | 8 |
| 11 | New Jersey | 7.4 |
| 12 | Louisiana | 7.3 |
Sources
Previous Daily Briefs
A new United States brief is written every day — each with its own risk map and downloadable CSV. Here's the last week; use the calendar to go further back.
📅 Browse every day by calendar →
Highlighted days have a brief. Tap a day for that day's map & analysis, or “csv” for that day's dataset ($5).