Situation Summary
Uzbekistan remains classified as a low-threat environment globally (composite score 6/100) with no verifiable major security incidents, civil unrest, or infrastructure failures reported in the last 24–48 hours. However, sub-national risk concentration in Navoiy Region (31.2) and Tashkent (26.9) reflects ongoing industrial safety concerns and administrative tensions rather than acute conflict or instability. The recent event signal cluster—dominated by diplomatic statements, banking communications, and U.S. investigative activity—suggests regulatory or bilateral friction rather than operational security deterioration on the ground.
Key Developments
No verifiable security, conflict, civil-unrest, crime, or infrastructure incidents have been independently confirmed in Uzbekistan during June 22–24, 2026. Open-source monitoring (X/Twitter, news feeds, web OSINT) has not surfaced time-stamped reports of protests, clashes, accidents, travel restrictions, or emergency declarations matching the last 24–48 hours.
Background context (undated but relevant to medium-term risk): Uzbekistan's government conducted nationwide safety audits of over 6,000 fuel facilities and suspended operations at 464 liquid-gas filling stations due to construction, fire, and technical-safety violations. No calendar date is confirmed; this measure may pre-date the current reporting window but signals ongoing industrial-safety enforcement and potential periodic fuel-supply disruptions.
Diplomatic and banking signal activity (June 22–23, undated in detail): Public statements involving U.S. representatives, ambassadors, and international banks have been flagged; concurrent U.S. investigative activity is noted. These signals lack operational security relevance in available reporting and do not indicate travel or asset risk inside Uzbekistan.
Highest-Risk Areas
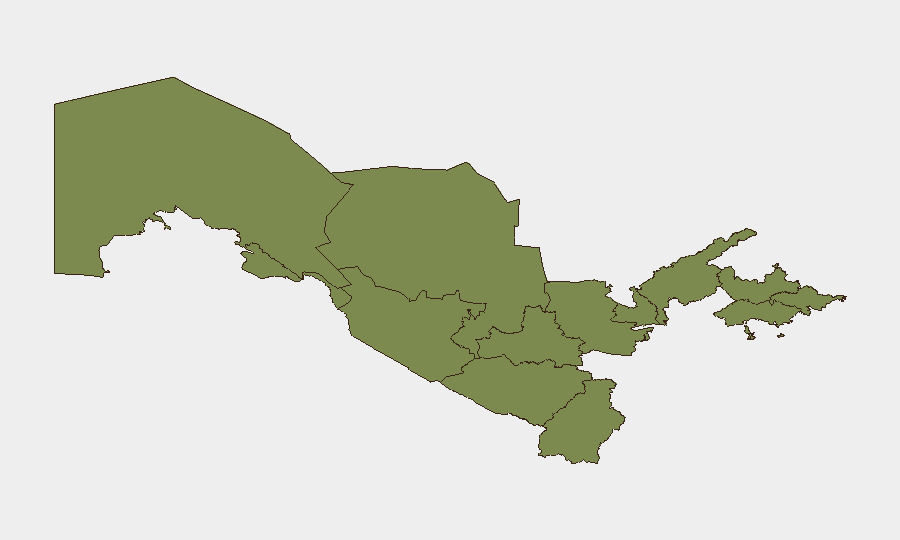
Navoiy Region and Tashkent account for 95% of tracked sub-national risk concentration. Navoiy's elevated score (31.2) is driven by industrial-safety concerns and past incidents at petrochemical and gas-processing facilities; Tashkent (26.9) reflects administrative tensions, diplomatic friction, and higher reporting density. Remaining regions (Bukhara at 5.5; all others at 1.2) show minimal tracked event activity and stable conditions. Risk concentration is not indicative of armed conflict or mass civil unrest but rather reflects safety regulation, economic-sector friction, and information-reporting asymmetry favoring the capital.
How GeoBit Would Assist
AOI Monitoring & Early Warning with persistent alert coverage of Navoiy petrochemical and gas infrastructure, Tashkent administrative centers, and transport corridors would detect facility incidents, protests, or supply disruptions before they escalate. OSINT Fusion & Corroboration (multi-language web, X/Twitter, Telegram, entity extraction, temporal analysis) would filter diplomatic noise from operational security developments and time-stamp emerging threats. Routing & Network Analysis for personnel and supply chains would enable real-time alternative-route planning if infrastructure disruptions or administrative closures occur in high-risk zones.
7-Day Outlook
No acute deterioration is anticipated. Industrial-safety enforcement and diplomatic communication will likely continue at current levels. Personnel and asset security posture in Navoiy and Tashkent should remain calibrated to medium-term industrial-safety risk and administrative unpredictability rather than acute conflict; routine duty-of-care protocols remain appropriate.
Highest-Risk Areas — Ranked
| # | State / Region | Risk |
|---|---|---|
| 1 | Navoiy Region | 31.2 |
| 2 | Tashkent | 26.9 |
| 3 | Bukhara Region | 5.5 |
| 4 | Qashqadaryo Region | 1.2 |
| 5 | Surxondaryo Region | 1.2 |
| 6 | Fergana Region | 1.2 |
| 7 | Republic of Karakalpakstan | 1.2 |
| 8 | Xorazm Region | 1.2 |
| 9 | Jizzakh Region | 1.2 |
| 10 | Tashkent Region | 1.2 |
| 11 | Namangan Region | 1.2 |
| 12 | Sirdaryo Region | 1.2 |
Sources
Previous Daily Briefs
A new Uzbekistan brief is written every day — each with its own risk map and downloadable CSV. Here's the last week; use the calendar to go further back.
📅 Browse every day by calendar →
Highlighted days have a brief. Tap a day for that day's map & analysis, or “csv” for that day's dataset ($5).