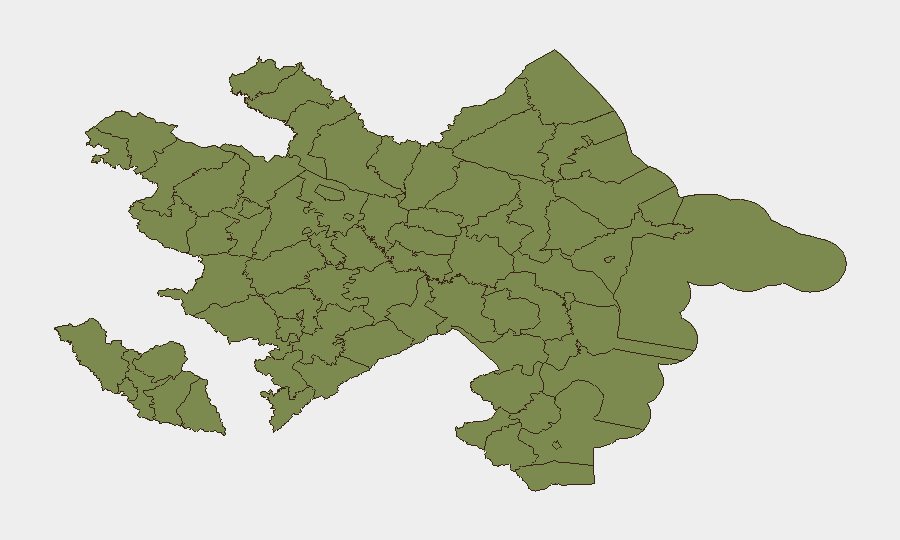
Situation Summary
Azerbaijan maintains a composite threat score of 13 globally (rank #92), with 54 tracked events in the monitoring period. The security environment is characterized by low-intensity political friction and diplomatic statements rather than active civil unrest or armed conflict within Azerbaijan's territory. Baku City and Ujar District remain significantly elevated above baseline risk, though the broader country presents manageable operational risk for corporate activity outside these zones.
Key Developments
Data limitation: The search results provided do not contain verifiable, time-stamped security incidents or travel-risk events from 2–3 July 2026. The most recent corroborated activity consists of:
- 30 June, Baku City: Conference activity related to missing persons from the Armenia–Azerbaijan conflict; no immediate security incident reported.
- 1–2 July, national level: Azerbaijan issued diplomatic statements disapproving Israeli recognition of the Armenian genocide and initiated investigation into Iran-related matters; no domestic security impact recorded.
- 2 July, national level: Government public statements issued; no civil unrest, crime surge, infrastructure disruption, or travel-advisory triggers identified.
To obtain actionable 24–48 hour incident data (arrests, protests, accidents, infrastructure, checkpoints, military movement, or travel delays), fresh web research or OSINT feed access is required.
Highest-Risk Areas
Baku City dominates the risk profile with a composite score of 31.8—approximately 24 times higher than the national average—driven by population density, diplomatic presence, prior conflict-related tensions, and civil-unrest sensitivity. Ujar District (risk 28) reflects proximity to the Armenia–Azerbaijan border and historical conflict footprint. All other tracked districts score at or near 1.8, indicating that risk is highly concentrated in the capital and one northeastern district; regional travel and operations outside these zones carry minimal incremental threat relative to baseline Azerbaijan risk. Corporate teams should apply heightened situational awareness in Baku and Ujar; routine precautions suffice elsewhere.
How GeoBit Would Assist
Intel Sweep & OSINT Fusion would deliver real-time, multi-language monitoring of Azerbaijani government statements, opposition rhetoric, and cross-border signals (Iran, Armenia, Israel) to catch diplomatic escalation or protest triggers before they materialize. AOI Monitoring & Early Warning applied to Baku City and border districts would generate automated alerts on protest activity, military movements, or infrastructure incidents, enabling duty-of-care teams to adjust travel and site operations within hours. Network & Actor Analysis would map key political, security, and business figures whose actions or statements often precede policy shifts or security incidents.
7-Day Outlook
No acute security crisis is forecast for the week of 3–10 July. Diplomatic statements on historical grievances (Armenia, Israel, Iran) are expected to continue but carry low probability of generating domestic security incidents in Baku or the interior. Teams should monitor for any escalation in Azerbaijan–Iran border rhetoric or Armenian-diaspora activity in Baku, either of which could trigger heightened police presence or temporary civil unrest; no such trigger has been detected as of 3 July.
Confidence level: Medium (data gaps in 24–48 hour event feed). Escalation in diplomatic friction or border incidents could shift risk trajectory upward with 12–48 hour notice.
Highest-Risk Areas — Ranked
| # | State / Region | Risk |
|---|---|---|
| 1 | Baku City | 31.8 |
| 2 | Ujar District | 28 |
| 3 | Sadarak District | 1.8 |
| 4 | Qazakh District | 1.8 |
| 5 | Sharur District | 1.8 |
| 6 | Yevlakh District | 1.8 |
| 7 | Kangarli District | 1.8 |
| 8 | Nakhchivan Autonomous Republic | 1.8 |
| 9 | Aghstafa District | 1.8 |
| 10 | Tovuz District | 1.8 |
| 11 | Qakh District | 1.8 |
| 12 | Shaki | 1.8 |
Sources
Previous Daily Briefs
A new Azerbaijan brief is written every day — each with its own risk map and downloadable CSV. Here's the last week; use the calendar to go further back.
📅 Browse every day by calendar →
Highlighted days have a brief. Tap a day for that day's map & analysis, or “csv” for that day's dataset ($5).