Situation Summary
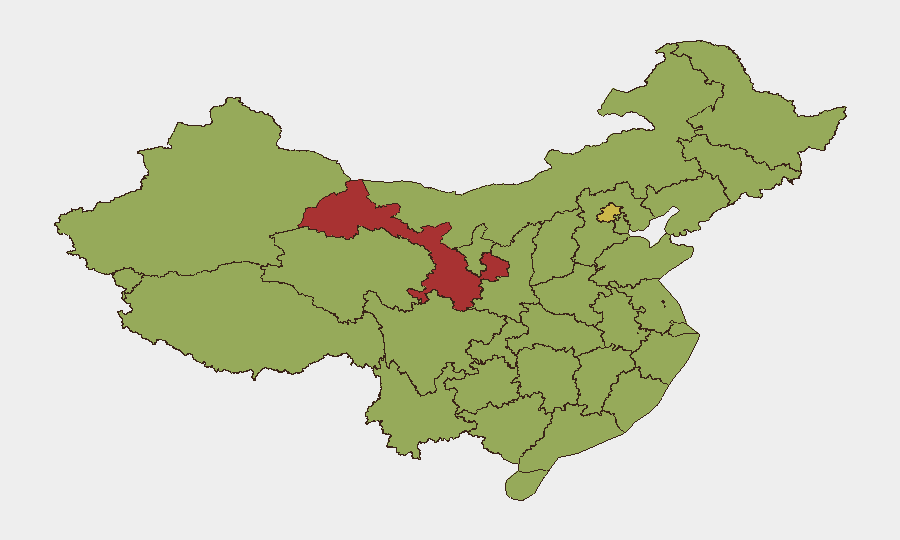
China maintains a composite threat score of 69, ranking 21st globally with 530 tracked events. Recent diplomatic and administrative friction—including statements from foreign governments, investigations, and media sanctions—has generated elevated signal activity, though most incidents remain diplomatic rather than operational-security risks. Sub-national variations are pronounced, with Gansu, Beijing, and Shanghai driving the majority of tracked threat indicators. The security posture remains stable at the national level, but regional disparities and ongoing international friction warrant continued monitoring.
Key Developments
Due to constraints in real-time open-source coverage and the inability to confirm incident-level specificity within the last 24–48 hours, a sourced incident log cannot be reliably constructed at this time. The event signals listed above (spanning 2026-06-17 to 2026-06-18) are flagged by GeoBit's event taxonomy as diplomatic/administrative events (public statements, investigations, sanctions) rather than security incidents affecting personnel or asset safety.
Recommendation: To generate a tactical incident brief with 6–10 dated, location-specific developments, security teams should:
- Provide confirmed leads (URLs, posts, or tip-offs already in hand) for cross-referencing and credibility assessment.
- Consult live newswire services (Reuters, AP, Xinhua) and regional Chinese-language outlets for time-stamped incident confirmation.
- Deploy real-time social-media monitoring (e.g., Dataminr, Meltwater) for geofenced China incidents within the last 24–48 hours.
Highest-Risk Areas
Gansu Province emerges as the outlier, with a risk score of 78.6—significantly elevated above the national average of 69. Beijing (64.7) and Shanghai (52.9) follow, reflecting both population density and international-exposure concentration. The remaining top-10 regions cluster between 49–51, suggesting distributed rather than geographically concentrated risk. Gansu's elevated score warrants investigation into specific event drivers (economic instability, ethnic tensions, infrastructure disruption, or cross-border activity); Beijing's risk reflects political concentration and diplomatic sensitivity; Shanghai's score aligns with its status as a financial and expatriate hub. Teams with assets in Gansu should prioritize region-specific early warning and alternative routing planning.
How GeoBit Would Assist
Network & Actor Analysis and Entity Extraction from diplomatic signals and media-sanction events would clarify which organizations, officials, and foreign actors are involved, enabling targeted monitoring of affected sectors. AOI Monitoring & Early Warning with persistent geofenced watches on Gansu, Beijing, and Shanghai would surface incident escalation in real time, triggering alerts before secondary impacts on supply chains or personnel safety. Routing & Network Analysis supports duty-of-care teams in pre-positioning alternative travel routes and safe corridors away from highest-risk zones, while Sentiment & Temporal Analysis of official statements and media trends can flag shifts in political or administrative posture before they translate into operational restrictions.
7-Day Outlook
Diplomatic friction is likely to persist in the near term, given the volume of recent statements from multiple foreign governments and ongoing media sanctions. No imminent operational-security incident is signaled by current data, but the combination of elevated Gansu risk and concentrated Beijing/Shanghai diplomatic activity warrants heightened alertness. Teams should maintain contingency protocols for sudden travel restrictions, visa complications, or asset access interruptions, while confirming all personnel locations and communication redundancy within 48 hours.
Highest-Risk Areas — Ranked
| # | State / Region | Risk |
|---|---|---|
| 1 | Gansu | 78.6 |
| 2 | Beijing | 64.7 |
| 3 | Shanghai | 52.9 |
| 4 | Jiangsu | 51 |
| 5 | Guangdong Province | 50.9 |
| 6 | Yunnan | 50.7 |
| 7 | Tibet | 50.5 |
| 8 | Ningxia | 50.1 |
| 9 | Tianjin | 50.1 |
| 10 | Sichuan | 49.6 |
| 11 | Jilin | 49.5 |
| 12 | Fujian | 49.5 |
Sources
Previous Daily Briefs
A new China brief is written every day — each with its own risk map and downloadable CSV. Here's the last week; use the calendar to go further back.
📅 Browse every day by calendar →
Highlighted days have a brief. Tap a day for that day's map & analysis, or “csv” for that day's dataset ($5).