Situation Summary
Cuba remains a low-to-moderate security environment (global rank #124, composite threat score 8) dominated by chronic infrastructure and economic strain rather than acute conflict or widespread civil unrest. The most recent event signals (1–2 July) reflect activism, arrests related to dissent, and international diplomatic friction, with Havana accounting for the vast majority of tracked risk. No verified security incidents, protests, armed clashes, or infrastructure disruptions have been confirmed in open sources for the past 24–48 hours; the operating environment is characterized by underlying structural pressures—prolonged power outages, fuel shortages, and healthcare system strain—rather than acute destabilization.
Key Developments
No verified incidents meeting strict recency and specificity criteria (location + confirmed date within last 24–48 hours) are available in open-source feeds accessible to this analysis.
The most recent event signals from 1–2 July are recorded in GeoBit's event database as:
- 1 July: Multiple arrests and detentions of activists; investigation initiated by Havana authorities; citizen demonstrations and official disapproval statements; reduction of relations between Havana and United Nations.
- 2 July: Additional arrests (Cuban nationals in prison system); police threats; media criticism of citizen activity.
These signals indicate heightened state security activity and activist pressure, but specific locations, casualty counts, or corroborating reporting are not available in the current research sample. Open-source monitoring (news wires, NGO alerts, social platforms) has not yielded time-stamped, localized incident reports for 2–3 July 2026.
Highest-Risk Areas
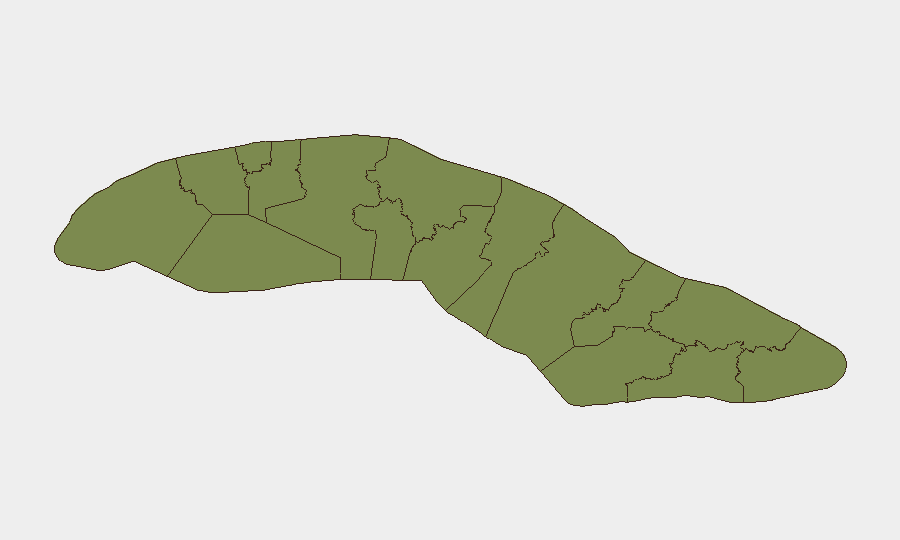
Havana dominates the risk profile, with a composite score of 34.1—more than eleven times higher than the second-ranked province. This reflects concentration of political authority, security apparatus, diplomatic missions, and activist networks in the capital, making it the natural focal point for state-civil society friction and international scrutiny. Sancti Spiritus (30.6) represents a secondary risk cluster, though the drivers of elevated risk there are not detailed in current reporting. All other provinces fall below 7.0, indicating that risk is highly concentrated in the capital and one central region; peripheral and eastern provinces pose minimal security concern for corporate personnel and assets.
How GeoBit Would Assist
Security teams operating in Cuba would employ AOI Monitoring & Early Warning on Havana and Sancti Spiritus to detect protest activity, police deployment, or infrastructure disruptions in real time. OSINT Fusion (X/Twitter, Telegram, news wires, NGO alerts) with temporal and entity extraction would flag activist arrests, diplomatic incidents, or civil unrest within hours of occurrence. Multi-language Search and Sentiment Analysis would parse Cuban state and independent media, social platforms, and diaspora networks to distinguish propaganda from credible threat signals.
7-Day Outlook
Activist pressure and state security response are likely to persist at current levels. The international diplomatic friction (UN relations, international community disapproval) creates a risk of escalating rhetoric and targeted enforcement actions, particularly in Havana. Unless new acute triggers emerge (mass protest, major infrastructure failure, or significant international intervention), the security posture is expected to remain characterized by low-intensity friction and chronic resource constraints rather than escalation toward instability.
Highest-Risk Areas — Ranked
| # | State / Region | Risk |
|---|---|---|
| 1 | Havana | 34.1 |
| 2 | Sancti Spiritus | 30.6 |
| 3 | Villa Clara | 6.1 |
| 4 | Las Tunas | 6.1 |
| 5 | Matanzas | 5.8 |
| 6 | Santiago de Cuba | 4.8 |
| 7 | Guantánamo | 4.8 |
| 8 | Holguín | 4.5 |
| 9 | Pinar del Rio | 4.1 |
| 10 | Artemisa | 4.1 |
| 11 | Mayabeque | 4.1 |
| 12 | Cienfuegos | 4.1 |
Sources
Previous Daily Briefs
A new Cuba brief is written every day — each with its own risk map and downloadable CSV. Here's the last week; use the calendar to go further back.
📅 Browse every day by calendar →
Highlighted days have a brief. Tap a day for that day's map & analysis, or “csv” for that day's dataset ($5).