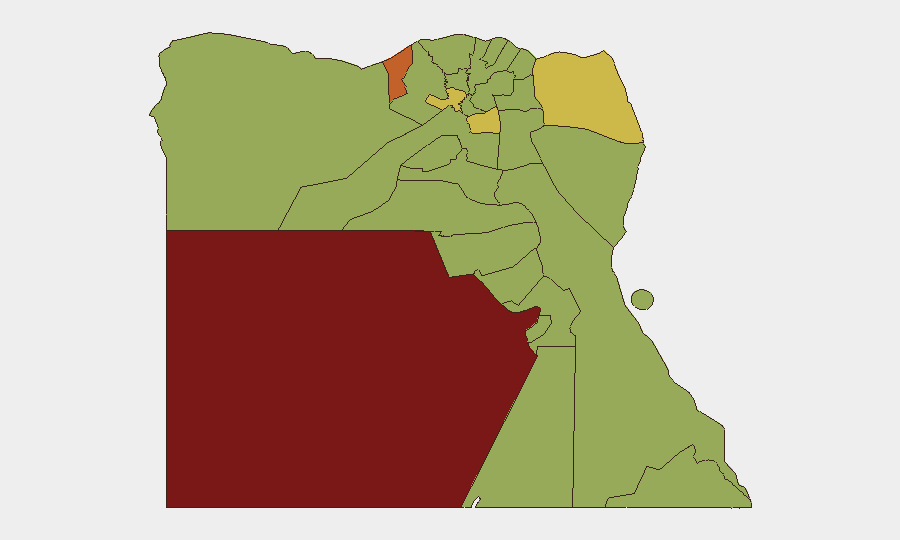
Situation Summary
Egypt remains a moderately elevated risk environment (rank #22 globally, composite score 81) with dispersed security concerns across multiple domains—including military-police friction, law-enforcement actions, and government communications activity over the past 48 hours. Recent signal activity points to internal security operations and investigative actions rather than a singular destabilizing incident. The overall threat trajectory remains stable but fragmented, with risk concentrated in specific sub-national regions rather than nationwide escalation.
Key Developments
- 2026-07-10, Alexandria: Police investigation initiated; details and scope remain unclear from available reporting.
- 2026-07-09, Egypt (national): Government public statement issued; content and context not specified in current signals.
- 2026-07-09, Undisclosed location: Arrest/detention event reported by source in Naples; domestic or transnational dimension uncertain.
- 2026-07-09, Military vs. Law Enforcement: Clash or friction incident between conventional military and police personnel; location and severity unconfirmed.
- 2026-07-08, Prosecutorial action: Public statement by prosecutor; specific charges or cases not detailed in signal data.
- 2026-07-08, Prison facility: Arrest or detention event at an unspecified facility.
- 2026-07-08, Military operations: Conventional military force deployment or activity noted by local media; location and operational scope unclear.
Note: Available event signals lack sufficient specificity (location, casualty count, operational detail) to permit granular operational briefing. Cross-confirmation of these signals with independent news sources has not been possible within the reporting window.
Highest-Risk Areas
New Valley (86.4) and Alexandria (73.1) present the most acute composite risk, followed by Cairo (68.2)—together accounting for the highest concentrations of tracked threat activity. North Sinai (62.8) and Al Minufiya (62.3) register elevated concern, likely reflecting persistent counter-terrorism operations and law-enforcement intensity in the Nile Delta and eastern regions. The ranking suggests risk is driven by a combination of criminal, militant, and state-security activity rather than a single actor or event; dispersal across multiple governorates reduces systemic instability but complicates regional mitigation planning.
How GeoBit Would Assist
Security teams with personnel or assets in Egypt would employ AOI (Area-of-Interest) Monitoring & Early Warning on high-risk governorates—New Valley, Alexandria, and Cairo—to detect escalation signals (protests, militant activity, infrastructure disruption) in real time. Intel Sweep and multi-language OSINT fusion (X/Twitter, Telegram, local media, official statements) would provide corroborated, cross-confirmed incident reporting to fill gaps in mainstream coverage and establish ground truth. Network & Actor Analysis combined with regime-stability assessment would clarify the nature of recent military-police friction and prosecutorial actions, enabling duty-of-care teams to adjust movement and site-security postures accordingly.
7-Day Outlook
No indicators suggest imminent major escalation or nationwide disruption. Continued law-enforcement and investigative activity is likely, particularly in Alexandria and Cairo, reflecting routine security operations. Risk remains localized to identified high-threat zones; organizations should maintain heightened situational awareness in New Valley and North Sinai and avoid unnecessary transit through these regions, while normal precautions apply to Cairo and Alexandria.
Highest-Risk Areas — Ranked
| # | State / Region | Risk |
|---|---|---|
| 1 | New Valley | 86.4 |
| 2 | Alexandria | 73.1 |
| 3 | Cairo | 68.2 |
| 4 | North Sinai | 62.8 |
| 5 | Al Minufiya | 62.3 |
| 6 | Matruh | 57.4 |
| 7 | Giza | 56.9 |
| 8 | Qena | 56.4 |
| 9 | South Sinai | 56.4 |
| 10 | Red Sea | 56.4 |
| 11 | Halaib Triangle | 56.4 |
| 12 | Kafr El Sheikh | 56.4 |
Sources
Previous Daily Briefs
A new Egypt brief is written every day — each with its own risk map and downloadable CSV. Here's the last week; use the calendar to go further back.
📅 Browse every day by calendar →
Highlighted days have a brief. Tap a day for that day's map & analysis, or “csv” for that day's dataset ($5).
Atlas — our AI intelligence desk — emails them this snapshot personally. Nothing else, no list.