Situation Summary
France remains at moderate composite threat (rank #46 globally; score 37/100), with 244 tracked events recorded. The most acute immediate risk stems from a severe nationwide heatwave (26–27 June) causing infrastructure strain, facility closures, and travel disruption rather than direct security incidents. Recent event signals include arrests, threats, diplomatic tensions (Congo–France), and police activity, though specific operational details remain limited in available reporting. The threat environment is stable but fragmented across multiple low-to-moderate concerns rather than concentrated acute risk.
Key Developments
- Paris (Louvre), 27 June: The Louvre has reduced operating hours to 4 p.m. closures through Saturday due to dangerous indoor heat buildup, affecting visitor access and staff safety during peak summer season.
- France (nationwide), 26–27 June: A severe heatwave is ongoing across France with government warnings, school closures, and modified schedules. This is a duty-of-care issue for personnel and asset operations, not a security incident, but affects mobility and facility operations.
- France, 25 June: An arrest/detention event was recorded (details not yet specified in available reporting).
- France, 26–27 June: Multiple public statements and disapproval noted from French authorities and European counterparts; content and context require deeper source corroboration.
- France, 26 June: A threat event was recorded; attribution and target remain unclear pending further intelligence.
- Congo–France diplomatic signal, 26 June: A public statement from Congolese actors expressing concern or criticism toward France was recorded; escalation trajectory unclear.
Highest-Risk Areas
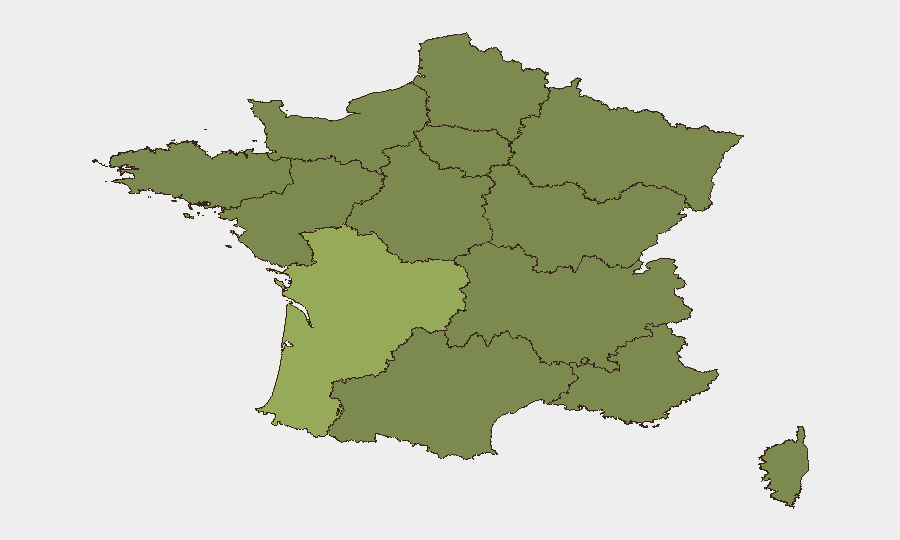
Nouvelle-Aquitaine (score 55.8) stands significantly above all other French regions and warrants priority focus; the gap between Nouvelle-Aquitaine and Île-de-France (36) suggests concentrated risk drivers—likely industrial, labor, or cross-border activity. Île-de-France (Paris region) carries the second-highest score and the largest population and economic density, amplifying consequence potential. The remaining ten regions cluster between 25.8 and 26.2, indicating distributed, moderate baseline risk. Monitoring should prioritize Nouvelle-Aquitaine for escalation and Île-de-France for volume and impact.
How GeoBit Would Assist
Security teams should deploy AOI Monitoring & Early Warning on Nouvelle-Aquitaine and Île-de-France to track emerging protest, labor, or diplomatic incidents in real time. Intel Sweep (global event feeds, X/Telegram OSINT, multi-language search) combined with Entity & Actor Network Analysis will clarify the arrests, threats, and Congolese statements recorded on 25–27 June and identify potential escalation patterns. Routing & Network Analysis supports contingency planning for personnel movement during heatwave disruptions and infrastructure strain.
7-Day Outlook
The heatwave is expected to persist through the weekend, maintaining operational friction on transport, facilities, and personnel schedules. Event signals (arrests, threats, diplomatic statements) do not yet indicate coordinated escalation, but low visibility on motivation and actors requires continuous monitoring. No major security incidents are forecast in the near term, but the spread and fragmentation of signals warrant sustained watch on Nouvelle-Aquitaine and close tracking of diplomatic Congo–France developments.
Highest-Risk Areas — Ranked
| # | State / Region | Risk |
|---|---|---|
| 1 | Nouvelle-Aquitaine | 55.8 |
| 2 | Ile-de-France | 36 |
| 3 | Normandy | 26.2 |
| 4 | Auvergne-Rhône-Alpes | 26.1 |
| 5 | Provence-Alpes-Côte d'Azur | 26.1 |
| 6 | Occitania | 26 |
| 7 | Hauts-de-France | 25.9 |
| 8 | Pays de la Loire | 25.9 |
| 9 | Bourgogne – Franche-Comté | 25.9 |
| 10 | Brittany | 25.8 |
| 11 | Centre-Val de Loire | 25.8 |
| 12 | Grand Est | 25.8 |
Sources
Previous Daily Briefs
A new France brief is written every day — each with its own risk map and downloadable CSV. Here's the last week; use the calendar to go further back.
📅 Browse every day by calendar →
Highlighted days have a brief. Tap a day for that day's map & analysis, or “csv” for that day's dataset ($5).