Situation Summary
Ghana remains a moderate-risk environment (global rank #127, composite score 7.0) with 48 tracked security events over the assessment period. Recent signal activity shows elevated public statements, official disapprovals, and one reported instance of violent repression as of 2 July, concentrated in Greater Accra Region. The trajectory suggests domestic political and labor tensions rather than sustained armed conflict, but the concentration of incidents in the capital warrants close monitoring of worker, resident, and state actor dynamics.
Key Developments
- 2 July, Greater Accra Region: Violent repression incident reported involving Ghanaian and African actors; specific location, casualty count, and trigger remain unconfirmed pending corroboration.
- 1 July, nationwide: Unconventional violence event flagged in Ghana; no geographic specificity or actor clarity in available signals.
- 30 June, Accra: Public disapproval recorded between city authorities and residents; suggests tension over local governance or service delivery.
- 30 June, nationwide: Central Bank issued demand directed at banking sector; financial stability or regulatory compliance context unclear without additional corroboration.
- 30 June, nationwide: Threat issued against Ghana from unspecified actor; nature and target of threat not detailed in signals.
- 30 June, nationwide: Presidential statement regarding worker grievances; suggests labor-related friction at state level.
Note: All signals above require urgent corroboration via credible news sources and social media verification. GeoBit event feeds have flagged these developments, but briefing team has not yet cross-referenced them with independent reporting.
Highest-Risk Areas
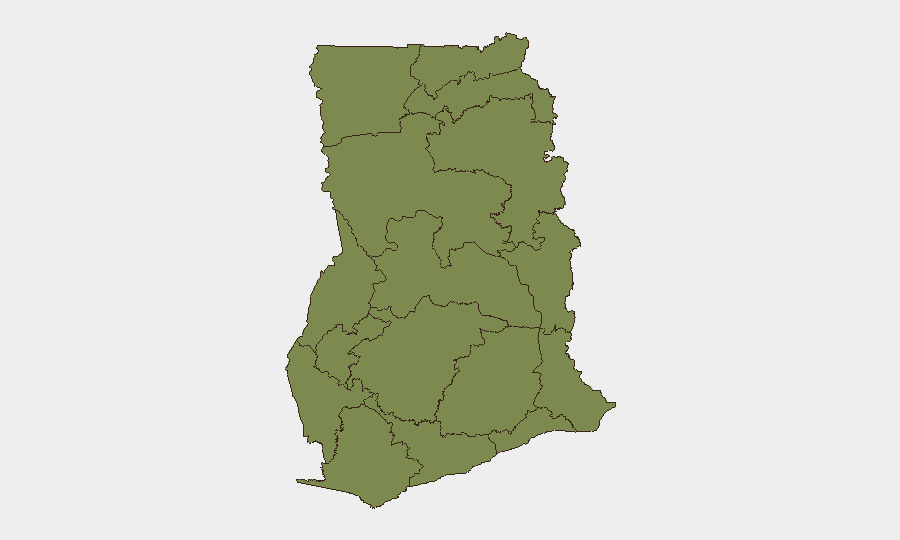
Greater Accra Region dominates the risk landscape, accounting for a composite score of 33.6—nearly 75% of Ghana's tracked threat concentration. This reflects a combination of population density, government presence, labor union activity, and protest dynamics in the capital. Bono East Region is the secondary concern at 23.8, though the drivers of risk in that region (economic, criminal, or political) require clarification. All remaining regions score between 3.6 and 4.6, indicating a sharp geographic concentration of monitored risk in the south-central belt rather than nationwide instability.
How GeoBit Would Assist
OSINT Fusion & Corroboration would immediately cross-reference the six unconfirmed signals above against news archives, X/Twitter feeds, and Telegram channels to establish timeline, actor identity, and casualty/impact specifics—critical for duty-of-care reporting. AOI Monitoring & Early Warning could establish persistent watches on Greater Accra and Bono East to alert security teams to protest activity, roadblocks, curfews, or official statements within 2–4 hours of occurrence. Network & Actor Analysis would map labor unions, civic groups, and state officials involved in current friction points, enabling teams to anticipate second and third-order incidents (e.g., strikes, counter-protests, official crackdowns).
7-Day Outlook
Expect continued public statements and disapprovals from state and civic actors over the next 7 days as labor and governance tensions remain unresolved. Risk of isolated incidents of violent repression or unconventional violence remains elevated in Greater Accra; however, no signals yet indicate escalation to organized armed mobilization or coordinated unrest. Security teams should treat the next 48–72 hours as a corroboration window and adjust contingencies once the nature of the 1–2 July incidents is confirmed.
Highest-Risk Areas — Ranked
| # | State / Region | Risk |
|---|---|---|
| 1 | Greater Accra Region | 33.6 |
| 2 | Bono East Region | 23.8 |
| 3 | Upper East Region | 4.6 |
| 4 | Volta Region | 4.1 |
| 5 | Upper West Region | 3.6 |
| 6 | Savannah Region | 3.6 |
| 7 | North East Region | 3.6 |
| 8 | Northern Region | 3.6 |
| 9 | Eastern Region | 3.6 |
| 10 | Oti Region | 3.6 |
| 11 | Bono Region | 3.6 |
| 12 | Ahafo Region | 3.6 |
Sources
Previous Daily Briefs
A new Ghana brief is written every day — each with its own risk map and downloadable CSV. Here's the last week; use the calendar to go further back.
📅 Browse every day by calendar →
Highlighted days have a brief. Tap a day for that day's map & analysis, or “csv” for that day's dataset ($5).