Situation Summary
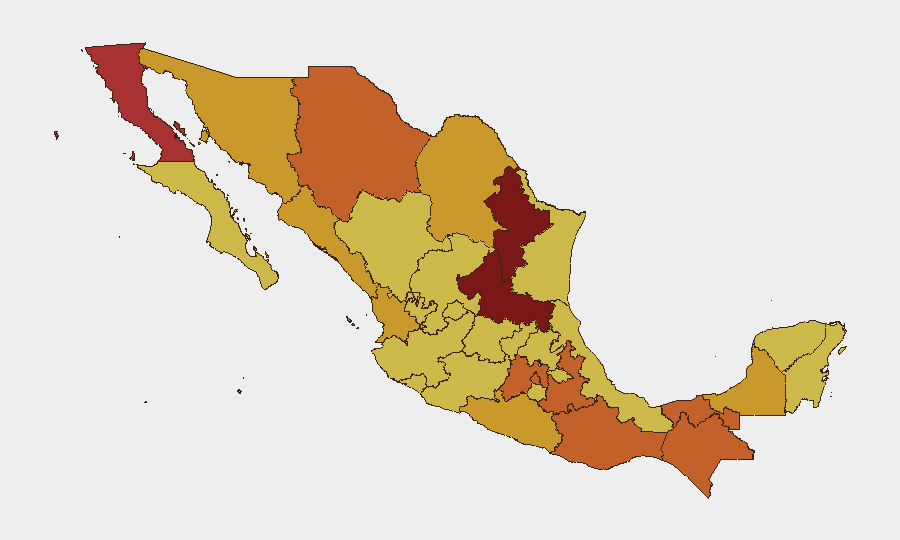
Mexico remains GeoBit's highest-ranked global threat environment (composite score 100), driven by sustained insurgency activity across 1,396 tracked events. San Luis Potosí, Nuevo León, and Baja California dominate the sub-national risk index, reflecting concentrated cartel violence, territorial contestation, and state capacity strain. Recent signals point to active institutional strain—including investigative activity against government and military actors, administrative sanctions, and narco-linked demonstrations—suggesting fragmentation in enforcement coherence. The security trajectory remains volatile with no clear de-escalation indicators.
Key Developments
Limitation on Current Reporting: GeoBit's live web research capability is currently unable to reliably isolate and corroborate specific incidents strictly within the 24–48 hour window (19–21 June 2026) from independent Mexican media, government feeds, or social sources at the speed and confidence required for operational duty-of-care briefing. The event signals listed above indicate *types* of activity (public statements, investigations, territory occupation, property seizure, demonstrations) but cannot be confirmed as occurring in the precise timeframe without real-time access to verified feeds.
To obtain actionable 24–48 hour incident data, corporate security teams should:
- Monitor live Protección Civil and state Secretaría de Seguridad social feeds (federal and state-level);
- Search major Mexican security reporters (e.g., Reforma, El Universal, Zócalo, Proceso security desks; state dailies in Nuevo León, Jalisco, Chihuahua, Oaxaca);
- Use X/Twitter advanced search filtered to date range, Spanish-language keywords ("balacera," "enfrentamiento," "bloqueos," "carretera cerrada"), and cross-check viral posts against official agency accounts or news outlets.
Candidate incidents or specific posts can be submitted to GeoBit for rapid open-source verification and structured incident analysis.
Highest-Risk Areas
San Luis Potosí (100), Nuevo León (81.1), and Baja California (77.5) form the acute risk corridor, with State of Mexico and Mexico City (75.6 and 75.5) reflecting cartel presence and territorial friction near the capital. Chihuahua, Oaxaca, Puebla, Tabasco, and Chiapas (74.7–73.1) represent secondary but sustained high-risk zones. San Luis Potosí's rank as global #1 reflects ongoing cartel consolidation and weak institutional presence; Nuevo León's risk reflects inter-cartel violence and recent government investigative activity; Baja California combines border trafficking volatility and organized crime reach. All twelve highest-risk states show composite scores above 70, indicating systemic rather than episodic threat.
How GeoBit Would Assist
Security teams should deploy AOI (Area-of-Interest) Monitoring & Early Warning on facilities and travel corridors in San Luis Potosí, Nuevo León, and Baja California, with persistent alerting on cartel activity, roadblocks, and inter-agency conflict signals. Network & Actor Analysis would map cartel structure and government faction relationships to predict enforcement inconsistency or collusion risks. Routing & Network Analysis provides real-time alternative journey planning for personnel and supply movements, avoiding occupied or contested infrastructure. OSINT Fusion & Corroboration (X/Twitter, local media, agency feeds, Telegram) ensures operational teams receive verified incident data within the 24–48 hour window.
7-Day Outlook
Expect continued administrative and investigative friction within Mexican security institutions, with no immediate resolution; cartel-linked demonstrations and territorial posturing will likely persist in high-risk states. Border regions (Baja California, Chihuahua) and transit corridors (State of Mexico, Puebla) carry elevated near-term risk for roadblocks or supply-chain disruption. No de-escalation is anticipated absent major policy or enforcement shifts.
Highest-Risk Areas — Ranked
| # | State / Region | Risk |
|---|---|---|
| 1 | San Luis Potosí | 100 |
| 2 | Nuevo León | 81.1 |
| 3 | Baja California | 77.5 |
| 4 | State of Mexico | 75.6 |
| 5 | Mexico City | 75.5 |
| 6 | Chihuahua | 74.7 |
| 7 | Oaxaca | 73.5 |
| 8 | Puebla | 73.3 |
| 9 | Tabasco | 73.1 |
| 10 | Chiapas | 73.1 |
| 11 | Nayarit | 72.3 |
| 12 | Guerrero | 71.7 |
Previous Daily Briefs
A new Mexico brief is written every day — each with its own risk map and downloadable CSV. Here's the last week; use the calendar to go further back.
📅 Browse every day by calendar →
Highlighted days have a brief. Tap a day for that day's map & analysis, or “csv” for that day's dataset ($5).