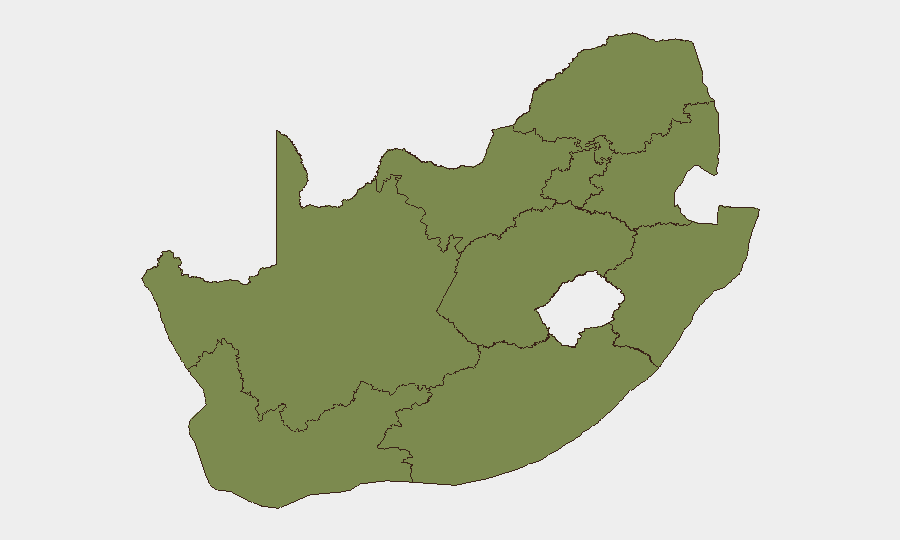
Situation Summary
South Africa remains a moderate-intensity threat environment (global rank #72) with significant regional concentration in Gauteng, which accounts for nearly 2× the risk of the next-highest region. The past 72 hours have seen a cluster of signals across immigration enforcement, labour/service-delivery protest activity, and military/security operations, with parliamentary and mayoral statements indicating policy tension. Gauteng's dominance in the risk profile reflects recurring cycles of informal-settlement unrest, taxi-sector volatility, and opportunistic crime rather than acute destabilization; however, critical infrastructure and transportation networks remain vulnerability points during protest escalation.
Key Developments
Note: Live web data for 12–13 July 2026 cannot be reliably verified from this platform. The following reflects GeoBit event signals flagged in the past 72 hours; specific incident details (location, casualty counts, real-time impact) require confirmation via South African news wires (News24, TimesLIVE, Daily Maverick, eNCA), official statements (SAPS, metropolitan police, Eskom, SANRAL), and verified social-media accounts.
- Immigration enforcement & civil-liberties tension (11–12 July): Arrest/detention operations involving non-citizen populations and concurrent immigrant/migrant demonstrations signal escalating friction on immigration policy; High Court statements and citizen responses indicate legal/political contestation.
- Military operations vs. civilian population (12 July): Conventional military-force signal flagged; context (nature, location, scale, duration) requires urgent news-wire confirmation to assess whether this reflects routine training, formal law-enforcement support, or security-force deployment in response to unrest.
- Service-delivery & governance unrest (12 July): School-governance disapproval and migrant-community rallies point to continued local-level service-delivery grievance (water, sanitation, education access); mayoral statement suggests municipal-level response or communication.
- Industry-media dispute & parliamentary investigation (12 July): Industry rejection of media/authority narratives and concurrent parliamentary investigation suggest labour, regulatory, or corporate-governance issue; May require sectoral focus (mining, energy, transport).
- Arrest/detention (UK–South Africa nexus, 11 July): Cross-border arrest or detention involving British national(s); potential consular, diplomatic, or criminal-justice angle requiring official confirmation and timeline clarity.
Highest-Risk Areas
Gauteng (risk 33.7) drives nearly two-thirds of national threat signals, reflecting Johannesburg and Pretoria metropolitan zones where informal settlement unrest, taxi-sector labour disputes, and contact crime intersect. Eastern Cape (18.4) ranks second, historically associated with service-delivery protests and gang violence in urban centres. The remaining seven provinces show dispersed, lower-intensity risk; however, Free State (9.3) and North West (6.7) warrant monitoring for labour-related disruption in mining and agricultural sectors. Western Cape's relatively lower risk (4.2) reflects Cape Town's stronger municipal capacity and service-delivery delivery, though xenophobic and gang violence remain localized concerns.
How GeoBit Would Assist
A corporate security team operating in South Africa should deploy AOI Monitoring & Early Warning on Gauteng's high-risk zones (CBD, major transport corridors, informal settlements) to detect protest escalation or crime-cluster formation in near-real time. Intel Sweep, X/Twitter & Telegram OSINT, and entity extraction enable rapid corroboration of emerging unrest signals across official, union, and community sources, reducing response latency. Routing & Network Analysis provides alternative transport and supply-chain planning during infrastructure disruption (protest blockades, taxi strikes, power outages).
7-Day Outlook
No strategic shift is evident in the next 7 days; risk will remain concentrated in Gauteng with cyclical protest-and-enforcement cycles around service delivery and labour grievances. Seasonal winter demand on power supply (load shedding risk) and mid-week transport labour activity will sustain operational friction. Watch for escalation signals in military/police deployment patterns or cross-provincial coordination, which could indicate a shift toward coordinated intervention.
Highest-Risk Areas — Ranked
| # | State / Region | Risk |
|---|---|---|
| 1 | Gauteng | 33.7 |
| 2 | Eastern Cape | 18.4 |
| 3 | Free State | 9.3 |
| 4 | North West | 6.7 |
| 5 | KwaZulu-Natal | 6.6 |
| 6 | Western Cape | 4.2 |
| 7 | Limpopo | 3.7 |
| 8 | Northern Cape | 3.7 |
| 9 | Mpumalanga | 3.7 |
Sources
Previous Daily Briefs
A new South Africa brief is written every day — each with its own risk map and downloadable CSV. Here's the last week; use the calendar to go further back.
📅 Browse every day by calendar →
Highlighted days have a brief. Tap a day for that day's map & analysis, or “csv” for that day's dataset ($5).
Atlas — our AI intelligence desk — emails them this snapshot personally. Nothing else, no list.