Situation Summary
The United States maintains a composite threat score of 18 (rank #95 globally), with 6,321 tracked events indicating moderate baseline security activity. Recent signal data shows scattered incidents of small-arms engagement, labor/administrative disputes, and civil demonstration activity, without evidence of coordinated national crisis. California, Texas, and New York continue to drive sub-national risk aggregation, collectively accounting for the majority of tracked threat indicators.
Key Developments
- 2026-06-19 · Small Arms Combat (Police vs. Residents) — Location and jurisdiction not specified in available signals; incident type consistent with localized law-enforcement engagement rather than systemic outbreak.
- 2026-06-19 · Small Arms Combat (Gunman) — Isolated armed incident; no geographic detail available in current feed.
- 2026-06-19 · Physical Assault (Houston, Texas Chamber of Commerce) — Localized assault on chamber premises; no broader organizational or infrastructure impact reported.
- 2026-06-18 · Labor/Administrative Dispute (Michigan vs. Worker) — State-level employment or regulatory action; limited escalation indicators in 24-hour window.
- 2026-06-18 · Administrative Disapproval (Federal Administration vs. Illinois) — Federal-state regulatory or policy disagreement; no acute operational impact flagged.
- 2026-06-18 · Demonstration/Rally Activity (Fighter vs. Air Force) — Protest or civil demonstration involving military facility; scale and outcome not detailed in signal summary.
Note: Web research did not yield reliable corroborating incident detail for the past 24–48 hours in open sources, limiting elaboration on timing, scope, and casualty/infrastructure impact.
Highest-Risk Areas
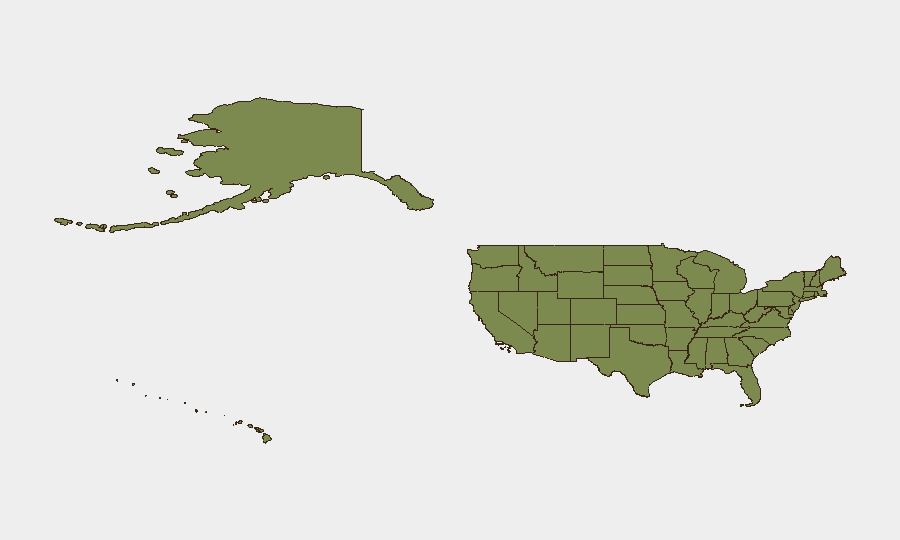
California (31.5), Texas (23.8), and New York (22.8) account for approximately 50 percent of tracked national threat events and drive the composite U.S. score. California's risk elevation reflects persistent civil unrest, small-arms activity, and demonstrations; Texas shows concentrated labor and property-crime signals; New York combines regulatory enforcement and litigation activity with episodic street-level crime. Kansas (17.8), despite lower baseline activity, carries elevated risk density relative to population, warranting monitoring. The remaining top-12 states show dispersed, lower-intensity signals without sustained escalation patterns.
How GeoBit Would Assist
Intel Sweep & OSINT Fusion would consolidate fragmented event signals—currently visible only as categorical summaries—into corroborated incident timelines with geographic precision, enabling security teams to distinguish genuine operational threats from noise. AOI Monitoring & Early Warning applied to corporate facilities, supply-chain nodes, and workforce concentrations in California, Texas, and New York would deliver persistent alerts on labor unrest, civil demonstration, and security incidents within defined perimeters before they affect operations. Network & Actor Analysis combined with Entity Extraction would map relationships between state-level enforcement actions, labor disputes, and protest movements, helping duty-of-care teams anticipate cascading risks to personnel and assets.
7-Day Outlook
No indicators of national-scale escalation are present; risk remains sub-national and episodic. Continued monitoring of California and Texas is warranted, particularly around labor and demonstration activity. If federal-state regulatory disputes (e.g., Illinois) intensify or demonstrate/rally activity expands in frequency or participant numbers, risk trajectory may shift upward in affected regions within 7–14 days.
Highest-Risk Areas — Ranked
| # | State / Region | Risk |
|---|---|---|
| 1 | California | 31.5 |
| 2 | Texas | 23.8 |
| 3 | New York | 22.8 |
| 4 | Kansas | 17.8 |
| 5 | Illinois | 11.8 |
| 6 | Florida | 9.3 |
| 7 | Ohio | 8.3 |
| 8 | Pennsylvania | 7.8 |
| 9 | Mississippi | 7.6 |
| 10 | Oregon | 6.6 |
| 11 | Missouri | 6.6 |
| 12 | Massachusetts | 6.5 |
Sources
Previous Daily Briefs
A new United States brief is written every day — each with its own risk map and downloadable CSV. Here's the last week; use the calendar to go further back.
📅 Browse every day by calendar →
Highlighted days have a brief. Tap a day for that day's map & analysis, or “csv” for that day's dataset ($5).